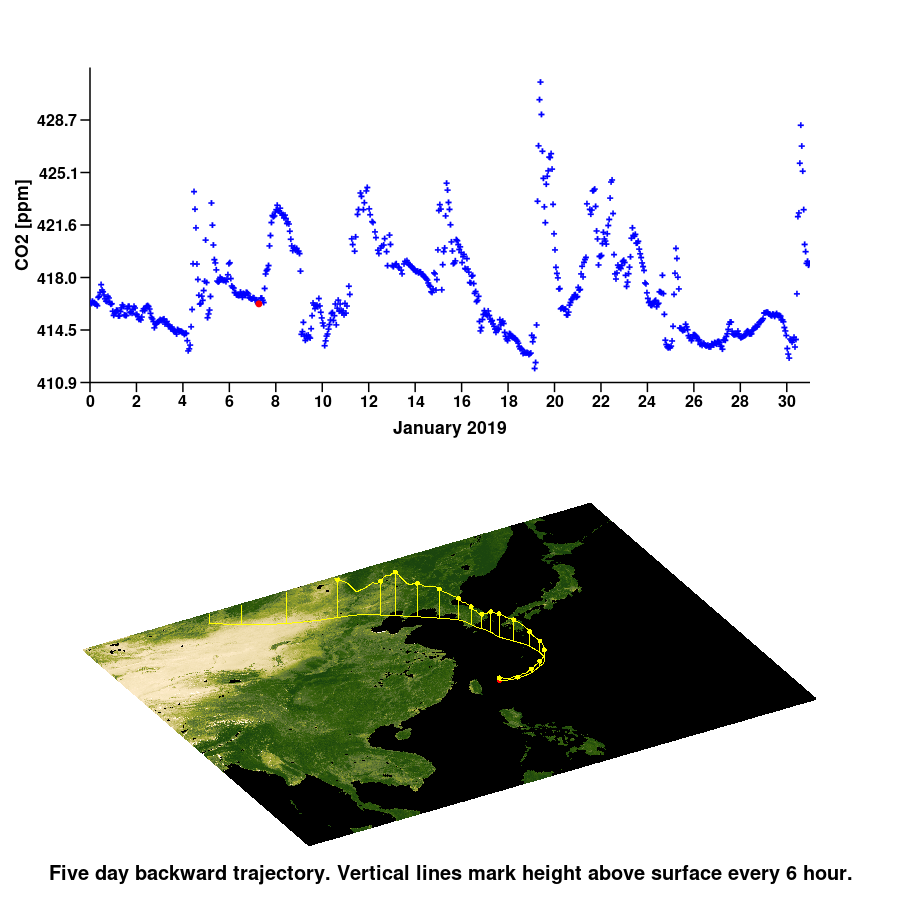
Animation of CO2 Concentration and Backward Trajectory
Animation of CO2 Concentration and Backward Trajectory
This page shows animations of the hourly CO2 variations observed at Hateruma and Cape Ochiishi, which are two of the global environment monitoring stations of the Center for Global Environmental Research, Earth System Division, National Institute for Environmental Studies along with 5-day back trajectories starting at 500 m above the stations and the observation time.
For more information about the trajectory model, please refer to here.
| Calculation period | Hateruma: 1994 - 2020 Cape Ochiishi: 1996 - 2013 |
|---|---|
| Start location of calculation | Hateruma (Latitude: 24.0608N, Longitude: 123.8093E) 500 m above the surface Cape Ochiishi (Latitude: 43.1602N, Longitude: 145.4973E) 500 m above the surface |
| Trajectory length | 5 days |
| Trajectory model | 3D-wind (kinematic) model |
| Time integration direction | Backward |
Anthropogenic CO2 emission is a major factor for global warming. This animation demonstrates the relation between observed hourly CO2 variations at Hateruma and Ochiishi stations and 5-day back trajectories starting at 500 m above the stations. Generally, CO2 concentration changed significantly when air passed through potential source or sink regions, but of course the relation was governed by many other factors, such as season, past weather condition, altitude of trajectory, uncertainty in trajectory calculation, and etc.
