Metadata
(Accesstion Number: ERDP-2016-01)
Title
Photosynthesis and primary production in Lake Kasumigaura (Japan) monitored monthly since 1981
Authors
Noriko Takamura and Megumi Nakagawa
Center for Environmental Biology and Ecosystem Studies, National Institute for Environmental Studies, Tsukuba, Japan
Email: cebes.data@nies.go.jp
Telephone number: +81-298-50-2471, Fax number: +81-298-50-2577
Address: National Institute for Environmental Studies, Onogawa 16-2, Tsukuba 305-8506, Japan
Abstract
This study reports the primary production of phytoplankton determined with a 13C tracer, and their related variables, in Lake Kasumigaura, a shallow, hyper-eutrophic lake, and the second largest lake in Japan. Measurements were conducted monthly from August 1981 to March 2015 at four stations within the lake. Monitoring was a component of the Lake Kasumigaura Long-term Environmental Monitoring program, conducted by the National Institute for Environmental Studies (NIES) since 1977. The program collects data on water quality, and plankton and benthic communities. Lake Kasumigaura is registered as a core site of the Japan Long-term Ecological Research Network (JaLTER), which is a member of the International Long-term Ecological Research Network (ILTER).
This dataset includes daily primary production (Pzd: gC m-2 d-1) and the six parameters required to calculate Pzd: maximum photosynthesis rate (Pmax : gC gC-1h-1); light irradiance at the junction of the initial slope (α: (gC gC-1h-1) (μmol photon m-2s-1)-1) and Pmax of the photosynthesis vs. irradiance (P vs. E) curve (Ek: μmol photon m-2s-1); attenuation coefficient of photosynthetically available radiation (PAR) (KPAR: m-1 ); water depth at each sampling station (Zb, m); dissolved inorganic carbon (DIC: mgC L-1) and particulate organic carbon concentrations (POC: gC m-3); and chlorophyll a amounts (Chl.a: μg L-1). Daily primary production was calculated by obtaining a P vs. E curve over a short-term incubation (approximately 1 h) in a water tank using in situ water temperature in the laboratory, based on the field conditions of the sampling date. The dataset has been used for ecological studies as well as for management studies on water quality and ecosystems. This dataset is unique among the available published papers concerning lakes or primary production in various ecosystems, collected over a long period of time and freely available.
Keywords
- phytoplankton
- chlorophyll a
- carbon fixation with 13C
- primary production
- photosynthesis vs. irradiance (P vs. E) curve
- maximum photosynthesis rate
- shallow and eutrophic lake
- Lake Kasumigaura
- long-term monitoring
- ecosystem function
Introduction
Primary production is an essential function of ecosystems and creates organic substances. Since 1964, when the International Biological Program (IBP) began, primary production has been continuously measured in various ecosystems over several decades (Cadee and Hegeman 2002; Schulze 2006). In recent decades, various technical improvements have been made for measuring primary production. Such measurements have been conducted in sea and terrestrial regions, as carbon fixation estimates are indispensable for understanding global carbon emissions (e.g., Laws et al. 2002; Beer et al. 2010). Furthermore, primary production is considered a useful indicator of ecosystem functioning and can be used to understand the relationship between biodiversity and ecosystem functioning (e.g., Cardinale et al. 2012).
Phytoplankton are the main primary producers in lakes, and their characteristics are dependent on a variety of changing environmental factors, including meteorological, hydrological, nutritional, and biological (e.g., grazing) variables. Furthermore, phytoplankton are strongly influenced by recruitment from the various subsystems, including the littoral and benthic area of lakes and inflowing waters in watersheds. Therefore, primary production of freshwater phytoplankton has been extensively studied to understand how productivity changes in response to various environmental factors. Such measurements have increased our understanding of the matter flow of lake ecosystems and the mechanisms of eutrophication (e.g., Otsuki et al. 1985; Takamura et al. 1985; 1992; Stewart and Sprules 2011).
Since Steemann Nielsen (1952) introduced the 14C tracer technique for measuring photosynthesis, the primary production of phytoplankton in aquatic environments has mostly been studied in oligotrophic seas and lakes (e.g., Marra 2009). Measurements are usually conducted from sunrise to sunset, or for 24 h, using in situ bottle incubations. Certain technical terms have been defined in previous studies; for example, gross primary production (GPP) is defined as the photosynthetic carbon uptake that can be estimated using the oxygen light-dark method (O2LD) (Riley 1939) and/or 18O-labeling method (Dickson et al. 2001). GPP-O2LD estimations are obtained by determining the community respiration (CR) and net community production (NCP). CR represents the decrease in O2 in dark conditions over 24 h, and NCP represents changes in O2 over 24 h. The GPP-18O-labeling method measures the photosynthetic release of 18O from H218O during the daytime. However, carbon uptake measured using the 14C method, which is the most frequently used method, is considered closer to the net primary production (NPP) value (GPP value minus autotrophic respiration). However, uncertainties remain regarding the interpretation of these different methods. Previous studies, which have shown 14C uptake to be close to the NPP, usually did not consider the dissolved organic carbon (DO14C) release or fixed 14C re-mineralization during incubation. González et al. (2008) showed that DO14C release accounted for approximately 47% of the total fixed carbon. Further, they found that the total 14C uptake (including the dissolved and particulate organic carbon fractions) throughout the entire light period was close to the GPP. Researchers have also reported that 14C uptake is closer to the GPP when incubated for 6 to 12 h (e.g., Langdon et al. 1995). Weger et al. (1989) suggested that the 14C method can estimate the GPP in short incubations (1 to 3 h), because respiratory losses can be ignored. Therefore, incubation time is important when interpreting the measured value for 14C uptake of phytoplankton.
Because of the limited use of radioisotopes in situ in Japan, the O2 LD method was used until the 1970s. Ichimura (1958; 1960a; b; 1961) first measured the primary production of Lake Kasumigaura and reported chlorophyll a concentrations and gross production values in 1956–1957 of 10–40 mg m-3 and 0.1–2.2 g O2 m-2 d-1, respectively. Thereafter, the primary production from 1971–1979 was measured by Maeda et al. (1974), Tezuka et al. (1973; 1975), Iwakuma and Aizaki (1979) and Iwakuma and Yasuno (1981). The annual GPP mean in the main basin was estimated at 4.6 g O2 m-2 d-1 from 1972–1973 (Tezuka et al. 1973), 7.0 g O2 m-2 d-1 from 1973–1974 (Tezuka et al. 1975), and 9.0 g O2 m-2 d-1 in 1979 (Iwakuma and Yasuno, 1981). Thus, the O2 LD method could be used to measure the photosynthesis of phytoplankton in hyper-eutrophic Lake Kasumigaura. However, this method requires several hours of incubation for clear bottles and 24 h of incubation for dark bottles, because of its low sensitivity. This long time period induces a variety of possible errors (analytical precision plus sources of experimental error) because of the long-term exposures in only 100-mL bottles, including a considerable amount of Protista and bacteria, which are often promoted by allochthonous sources. Errors can also be introduced if the respiratory uptake of oxygen varies with light irradiance, and thus differs between light and dark bottles (Bender et al. 1987).
Our research group at the NIES replaced the O2 LD method with measurements using a 13C tracer in 1981. This method, devised by Otsuki et al. (1983), used a quadrupole mass spectrometer to perform simultaneous measurements and determinations of stable carbon and nitrogen isotope ratios in biological samples (Hama et al. 1983). This method has continued to be used to measure the photosynthesis of phytoplankton in Lake Kasumigaura (Takamura et al. 1987, Takamura and Aizaki 1991). We used short-term incubations (approximately 1 h), and calculated the primary production by obtaining a photosynthesis-irradiance (P vs. E) curve in a water tank using laboratory in situ water temperatures and field conditions.
This study reports on long-term changes in daily primary production measured with a 13C tracer and chlorophyll a concentrations. We measured the relevant variables used to calculate production: maximum photosynthesis rate (Pmax ; the light irradiance at the junction of the initial slope and Pmax of the P vs. E curve (Ek: μmol photon m-2 s-1); attenuation coefficient of photosynthetically available radiation (PAR) (KPAR); water depth at each sampling station (Zb); dissolved inorganic carbon (DIC); and particulate organic carbon (POC) concentrations. These data were monitored monthly from August 1981 to March 2015 at four stations on Lake Kasumigaura, a shallow, hyper-eutrophic lake that is the second largest lake in Japan. This dataset includes data on phytoplankton species abundance as published by Takamura and Nakagawa (2012b). It can be used for long-term ecological and environmental studies and contributes valuable information for use in further studies.
Monitoring was performed as part of the Lake Kasumigaura Long-term Environmental Monitoring program that has been conducted by the NIES since 1977. The program includes data collected on the water quality and plankton and benthic communities, and the dataset is part of the database of the Lake Kasumigaura Long-term Environmental Monitoring program. Lake Kasumigaura is registered as a core site of the Japan Long-term Ecological Research Network (JaLTER), a member of the International Long-term Ecological Research Network (ILTER).
Metadata
1. Title
Photosynthesis and primary production in Lake Kasumigaura (Japan) monitored monthly since 1981
2. Identifier
ERDP-2016-01
3. Contributor
A. Dataset owners
The National Institute for Environmental Studies (Japan) and the following individuals provided the data for the database.
| Owners and contact individual(*) | Affiliation | Contact | |||
|---|---|---|---|---|---|
| Address | Phone | Fax | Email address | ||
| Noriko Takamura* and Megumi Nakagawa | National Institute for Environmental Studies | Onogawa 16-2, Tsukuba 305-8506, Japan | +81-298-50-2471 | +81-298-50-2577 | noriko-t@nies.go.jp |
B. Dataset creators
- Noriko Takamura, Center for Environmental Biology and Ecosystem Studies, National Institute for Environmental Studies
- Megumi Nakagawa, Center for Environmental Biology and Ecosystem Studies, National Institute for Environmental Studies
4. Program
A. Title
Lake Kasumigaura Long-term Environmental Monitoring program
B. Personal
Organization:
National Institute for Environmental Studies
Address:
Onogawa 16-2, Tsukuba 305-8506, Japan
Phone:
+81-298-50-2471 (Voice)
Phone:
+81-298-50-2577 (fax)
Web Address:
http://www.nies.go.jp/
C. Funding
National Institute for Environmental Studies, Japan
D. Objectives
Since 1977, the National Institute for Environmental Studies (NIES) has conducted monthly monitoring of the water quality and plankton/benthos biomass in Lake Kasumigaura. This monitoring was initiated by several lake scientists of the NIES with the intention of sharing fundamental limnological data for their own research. The monitoring has subsequently continued for more than three decades to promote environmental and ecological studies and is expected to be used to increase our understanding of lake ecosystems over long-term periods and recover lake environments.
5. Geographic Coverage
A. Geographic description
Nishi-ura of Lake Kasumigaura, Japan
B. Geographical position
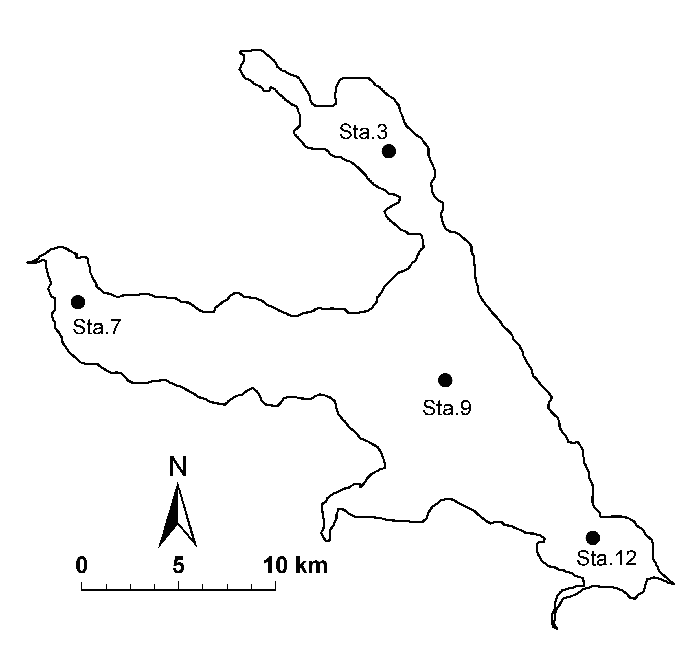
Station 3: 36°07.302′ N, 140°22.652′ E (WGS84)
Station 7: 36°03.902′ N, 140°13.993′ E (WGS84)
Station 9: 36°02.142′ N, 140°24.222′ E (WGS84)
Station 12: 35°58.593′ N, 140°28.332′ E (WGS84)
6. Temporal Coverage
A. Begin
August 1981
B. End
March 2015
7. Methods
A. Study sites
Lake Kasumigaura (Fig. 1) is located approximately 60 km northeast of the Tokyo metropolitan area. This lake is the second largest lake in Japan (surface area of 220 km2, with a total volume of 0.85 billion m3), and it is shallow (mean depth of 4 m, maximum depth of 7 m), with a catchment area of 2157 km2. The lake is composed of three parts: Nishi-ura, Kita-ura and Sotonasaka-ura. Nishi-ura, the largest part of the lake, has a surface area of 167.7 km2, a total volume of 662 million m3, 29 inflows and one major outflow. The Lake Kasumigaura Long-term Environmental Monitoring program is conducted at 10 sites in Nishi-ura, and primary production has been measured at four sites. The history of lake alterations caused by recent human activity and associated environmental problems are summarized in Takamura (2012).
B. Sampling and measurements of the environment in the field
Water samples were collected with an acrylic column sampler from the surface to a depth of 2.0 m. The attenuation coefficient of PAR in the water was measured with a Li-Cor LI-192S quantum sensor from June 1981 to March 1983, Biospherical QSP-170 from April 1983 to March 1989, Li-Cor LI-192SA/B with Li-Cor LI-1000 multichannel datalogger from April 1989 to September 2012, and Li-Cor Underwater UWQ 8014 with Hydrolab DS5 datalogger from October 2012 to March 2015. The water depth was measured with a weight.
C. Measurements of chlorophyll a, particulate organic carbon, dissolved inorganic carbon, and 13C and 12C ratios in the laboratory
The phytoplankton samples used to measure chlorophyll a concentrations were quantitatively collected by filtration with a Whatman GF/C filter from 1981 to 1990 and Whatman GF/F filter from 1991 to 2015. Chlorophyll a was extracted in 90% acetone from 1981 to 1985 and 100% methanol from 1986 to 2015, and the concentration was spectrophotometrically measured following UNESCO/SCOR (1966) and Marker et al. (1980), respectively. Particulate organic carbon was measured with a CHN analyzer (Yanaco MT-3 from 1981 to 1995 and Yanaco MT-5 from 1996 to 2015) after collection through filtration on a precombusted Whatman GF/C or GF/F filter (450℃ for 3 h). Dissolved inorganic carbon was measured with a TOC analyzer (Beckman, model 915-B from 1981 to July 1986, O.I. Corporation, model 700 from August 1986 to August 1995, Shimadzu TOC-5000A from September 1995 to June 2006, and Shimadzu TOC-VCSN from July 2006 to March 2015). The concentrations of organic carbon and isotope ratios of 13C and 12C in the sample were determined with a mass spectrometer facilitated with a combustion furnace (Anelba TE-150 from 1981 to 1995, Finnigan MAT DeltaPlus from 1996 to September 2009, and Thermo Fisher Scientific Delta V Advantage from October 2009 to March 2015).
D. Measurements of photosynthesis
To measure the carbon uptake, 0.5 mL NaHCO3 solution (0.5 mg L-1) was added to the water sample in six 100-mL BOD bottles. Five samples were incubated for 1 h at six light irradiance levels (0, 20, 50, 100, 300, and 1000 μmol photon m-2 s-1) in a water tank set at an in situ water temperature. The light sources included four 300-W tungsten lamps. To provide a uniform light irradiance and sample mix in the bottles, transparent acrylic boards (40 cm in diameter) with BOD bottles were rotated at a speed of 10 rpm facing the light. The light irradiance was reduced by placing opaque acrylic boards between the transparent acryl boards. After incubation, the BOD bottles were transferred to a dark box with ice. Each incubated phytoplankton sample in these bottles was collected on precombusted (450℃ for 3 h) Whatman GF/C or GF/F filters under dim light.
The photosynthetic rate (Pv; gC m-3 h-1) was calculated as follows (Hama et al. 1983):

where t1 is the duration of incubation (hour), B is the POC (B; gC m-3) at the end of the incubation, ais is the atom% of 13C in the POC of the incubated sample, aic is the atom% of 13C in the total inorganic carbon at the start of the incubation, and ans is the atom% of 13C in the POC of natural sample.
E. Calculation of daily production per unit area
A non-spectral model was used for estimating primary production. Smith’s equation (Smith 1936) was the best fitting to estimate the parameters of the P vs. E curve of phytoplankton in Lake Kasumigaura (Iwakuma and Yasuno 1983). The parameters of the P vs. E curve (Pg: gC gC-1 h-1) were:
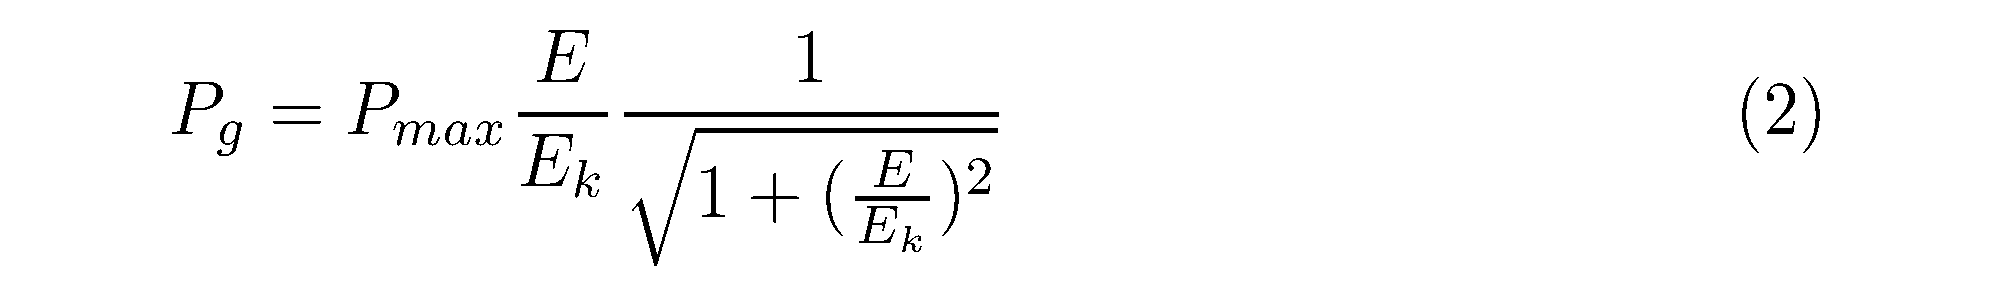
where Ek is the light irradiance (μmol photon m-2 s-1) at the junction of the initial slope, and Pmax because photoinhibition was scarcely observed (Takamura et al. 1987; Takamura and Aizaki 1991). Two parameters, the maximum rate of photosynthesis (Pmax: gC gC-1 h-1) and initial slope of the P vs. E curve (α : (gC gC-1 h-1) (μmol photon m-2 s-1)-1), were determined by the least squares method.
Phytoplankton were assumed to be homogeneously distributed in the water. The vertical profiles of P vs. E parameters were also assumed to be homogenous. The photosynthetic rate per unit area at time t (Pz(t): gC m-2 h-1) was calculated as follows:
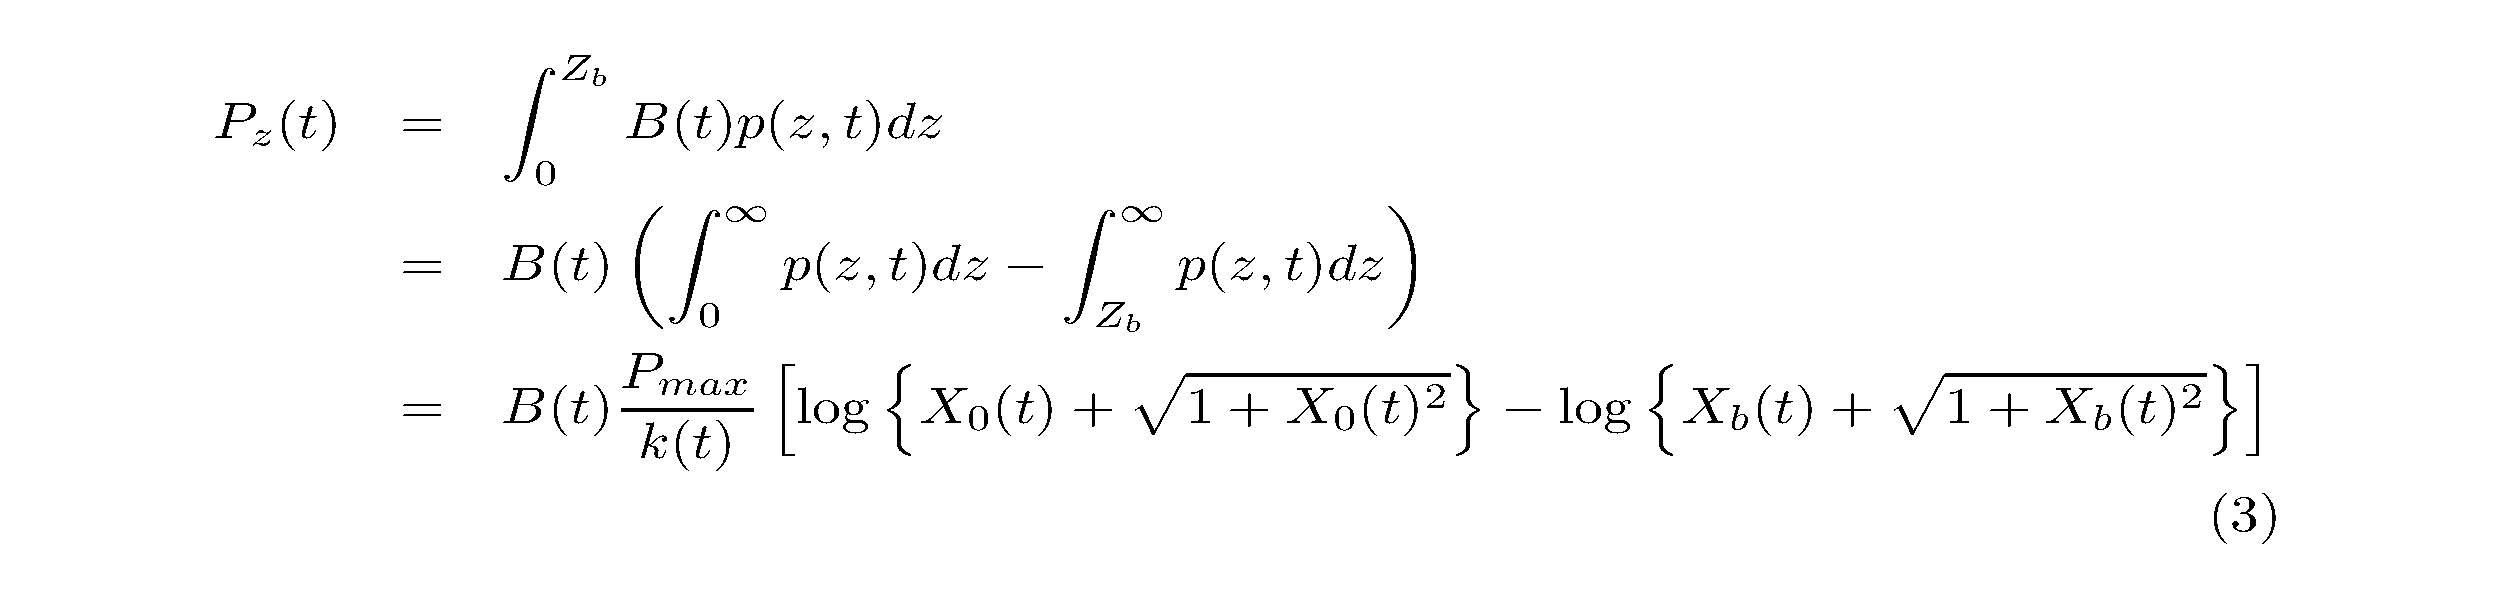
where B(t) is the biomass of phytoplankton (gC m-3), p(z, t) is the photosynthetic rate, k(t) is the attenuation coefficient of PAR (m-1), Zb is the water depth at each sampling station (m), and X0(t) and Xb(t) are dimensionless variables.
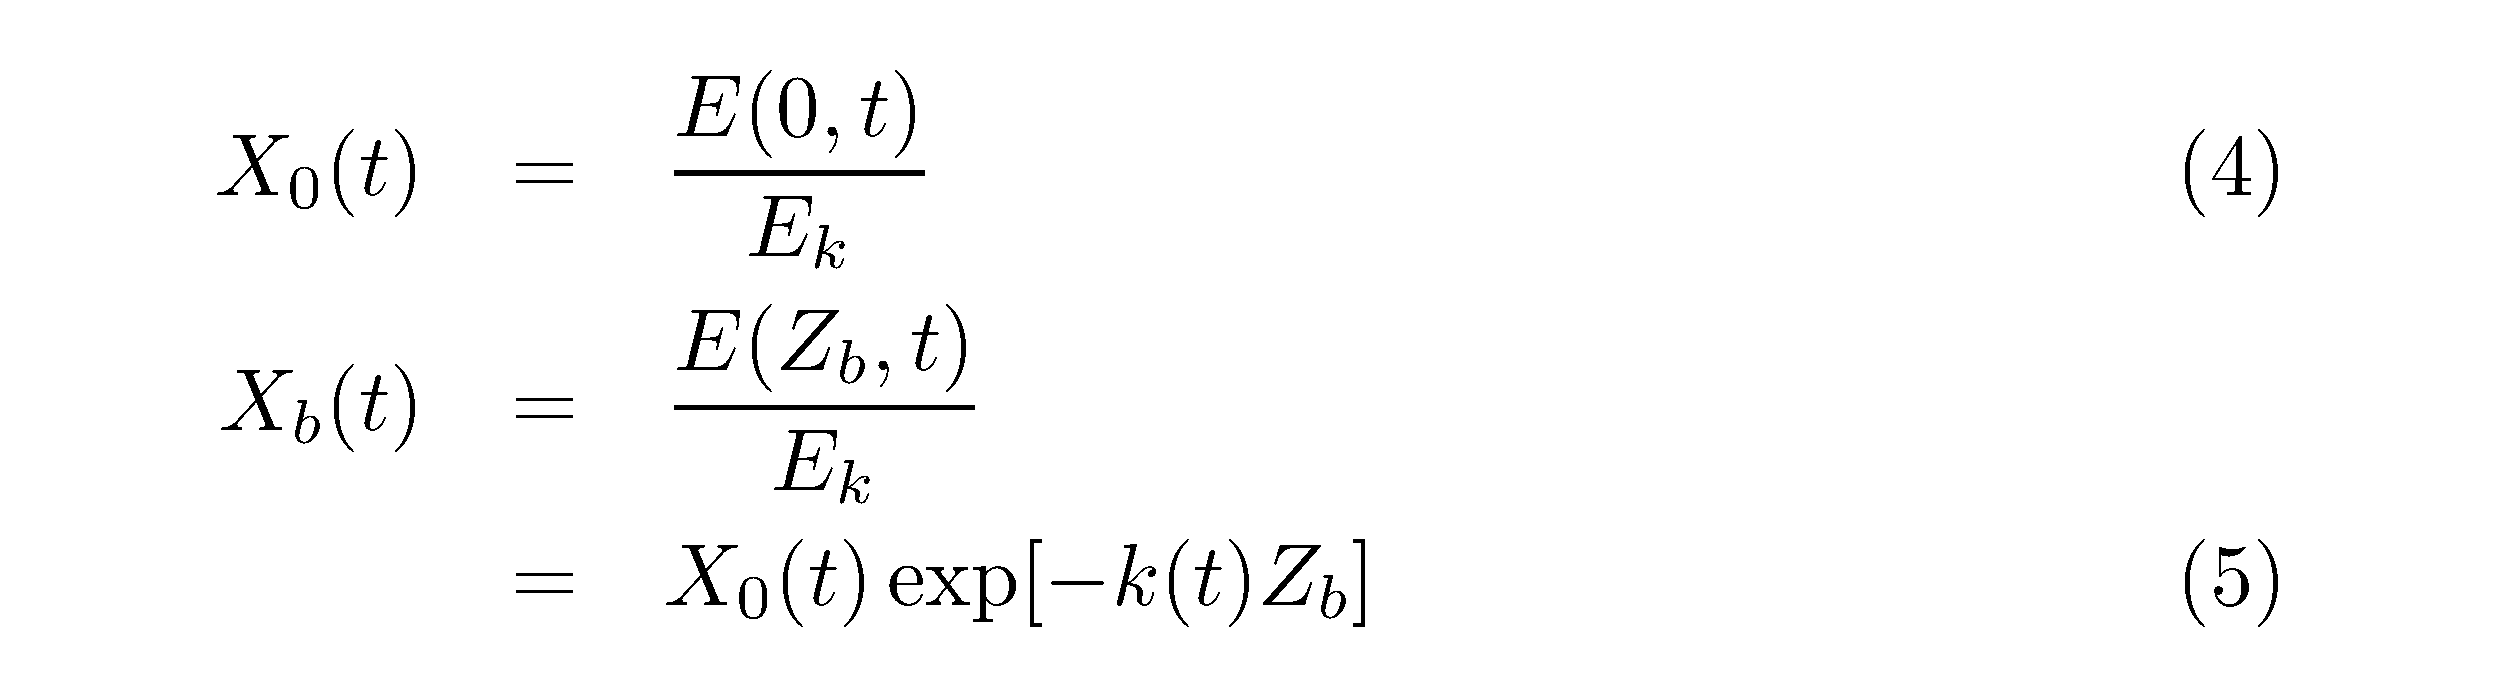
where E(0, t) and E(Zb, t) are the light irradiance (μmol photon m-2 s-1) at 0 m and Zb m water depth at each sampling station, respectively.
The daily production per unit area per day (gC m-2 d-1) was calculated as follows:
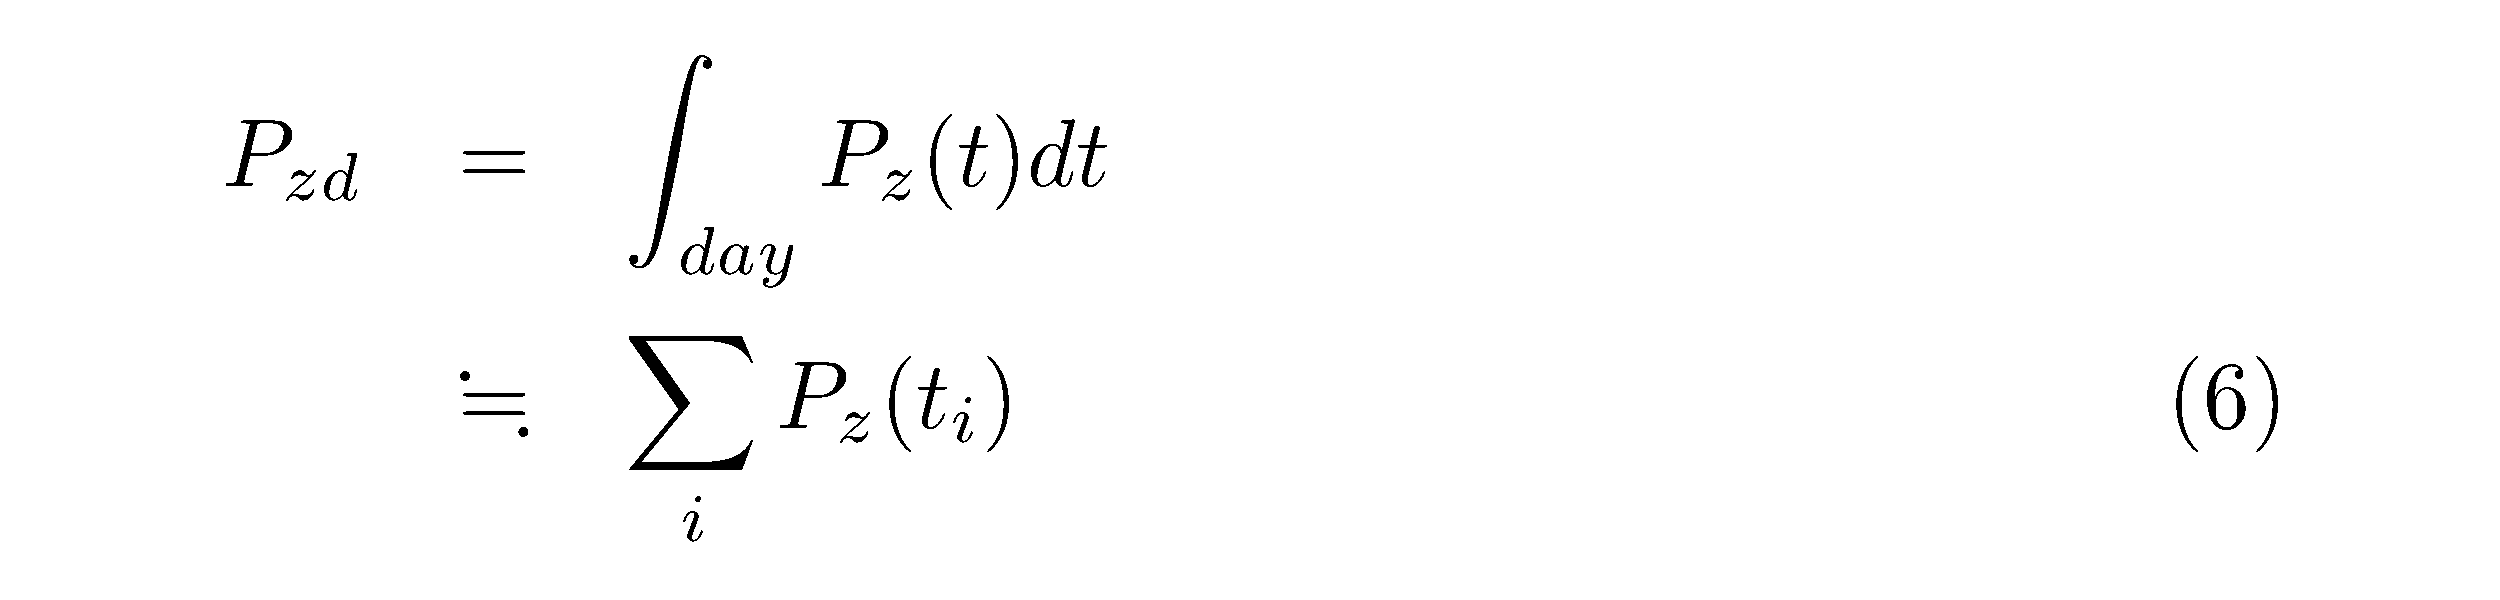
where Pz(ti) is the hourly value. The vertical profiles of phytoplankton biomass and P vs. E parameters were assumed to be constant over the day. The hourly incident solar radiation [L(t), MJ m-2 h-1] of each sampling day was obtained from the Tateno Meteorological Station (36°03.373′ N, 140°07.512′ E) of the Japan Meteorological Agency from 1981 to 1990 (http://www.data.jma.go.jp/obd/stats/etrn/index.php ) and Kasumigaura Water Research Station (36°00.350′ N, 140°22.363′ E) of NIES from 1991 to 2015 (http://www.cger.nies.go.jp/db/kasumi/index.html). The ratio of photosynthetically active energy of the natural daylight radiation to global solar radiation was assumed to be 0.45 (b1) (Vollenweider 1974). The light penetration coefficient through the water surface (b2) was determined as 0.95 (Takamura et al. 1986).
Thus, Eq.(4) becomes

Thus, 1 MJ m-2 h-1 was determined to be equal to 1262 μmol photon m-2 s-1. The B(t) and k(t) were assumed to be constant during the day.
When a missing value occurred for KPAR (m-1), Zb (m), DIC (mgC L-1) or POC (gC m-3), the daily production was calculated by interpolating the front and back data.
F. Data verification procedures
The data were manually digitized and checked for typographical errors by the investigators. If suspicious values remained, they were recorded as an error (see section 10.D).
8. Data Status
A. Latest update
19 March 2015
The dates of the data collection span the period from August 1981 to March 2015. Data will be collected continuously after March 2015, and the database will be updated as the data are verified.
B. Metadata status
The metadata are complete for this period and stored with the data.
9. Accessibility
A. License and usage rights
1) Acceptable use. The dataset should not be used for illegal purposes or to violate the rights of others. The use of the dataset will be restricted to academic, research, educational, governmental, or other not-for-profit professional purposes. Data users need to agree to the terms of use for NIES Lake Kasumigaura Database (http://db.cger.nies.go.jp/gem/moni-e/inter/GEMS/database/kasumi/contents/terms.html). Please make sure to contact the data manager of Lake Kasumigaura Database by email (cebes.data@nies.go.jp) before using the dataset.
2) Citation. Data users should properly cite this research paper in any publications or in the metadata of any derived data products that were produced using the dataset. Because the dataset will be updated and measuring methods will be modified as the techniques continue to develop, please verify that the latest version of the dataset is used.
3) Acknowledgement. To support this long-term monitoring activity, data users should write acknowledgements in any publications that include the dataset as follows: “Data for XXX were provided by the Lake Kasumigaura Long-term Environmental Monitoring program of the National Institute for Environmental Studies, Japan.”
4) Notification. Data users should notify the dataset contact person when any derivative work or publication based on or derived from the dataset is distributed. Please provide the dataset contact person with two reprints or a PDF file of any publications resulting from the use of the dataset.
5) Collaboration. Data users are strongly encouraged to consider consultation, collaboration and/or co-authorship with the data owners.
6) Disclaimer. In no event shall the authors, data owners, or National Institute for Environmental Studies be liable for a loss of profits or any indirect, incidental damages arising from the use or interpretation of the data.
B. Contact
Noriko Takamura or Megumi Nakagawa
Centre
for Environmental Biology and Ecosystem Studies, National Institute for
Environmental Studies, Onogawa 16-2, Tsukuba 305-8506, Japan
Telephone number: +81-298-50-2471
Email: cebes.data@nies.go.jp
C. Storage location
The data owners and National Institute for Environmental Studies store the original data.
10. Data Structure
A. Data tables
| Data file name | Description |
|---|---|
| primary_production.csv | Daily production by phytoplankton in the water per unit area per day (gC m-2 d-1), and the six parameters required to calculate the daily production, i.e., maximum photosynthesis rate (gC gC-1 h-1), the light irradiance at the junction of the initial slope ( (gC gC-1 h-1) (μmol photon m-2 s-1)-1) and Pmax of the photosynthesis vs. irradiance curve ( μmol photon m-2 s-1) , attenuation coefficient of PAR in the lake water column (m-1 ), water depth (m), dissolved inorganic carbon concentration (mgC L-1) and particulate organic carbon concentration (gC m-3 ), and chlorophyll a content (μg L-1) at each station on the sampling date. |
Considerable DIC data (shown as ‘b’) were lost because of an unfortunate flamelet that occurred in the laboratory before the data reduction procedure.
Ld data of the sampling date (2008/2/13) were missing and we used the following day’s data (2008/2/14), which had similar weather.
B: Format type
The data files are in ASCII text, comma delimited (csv).
C: Header information
Headers corresponding to variable names (see section 10.D) are included as the first row in the data file.
D: Variable definitions
The variables are listed in the order that they appear in the data file. Variable names are headers that are included as the first row in the data file. “NA” is the code for errors and missing values for all variables.
| Variable name | Variable definition | Unit | Storage type | Precision | Reference |
|---|---|---|---|---|---|
| date | Research day | yyyy/m/d | Date | NA | Data presented here |
| Sta | Station | 3 or 7 or 9 or 12 | Site Number | NA | Data presented here |
| PZD | Gross production per unit area per day | gC m-2 d-1 | Calculated value | 0.1 | Data presented here |
| Pmax | Maximum rate of photosynthesis | gC gC-1 h-1 | Calculated value | 0.001 | Data presented here |
| Ek | Light irradiance at the junction of initial slope and Pmax | μmol photon m-2 s-1 | Calculated value | 1 | Data presented here |
| KPAR | Attenuation coefficient of PAR in lake water column | m-1 | Calculated value | 0.1 | Data presented here and http://db.cger.nies.go.jp/gem/inter/GEMS/database/kasumi/index.html |
| Zb | Water depth | m | Real number | 0.1 | http://db.cger.nies.go.jp/gem/inter/GEMS/database/kasumi/index.html |
| DIC | Concentration of dissolved inorganic carbon | mgC L-1 | Real number | 0.1 | Data presented here |
| POC | Biomass of particulate organic carbon | gC m-3 | Real number | 0.1 | http://db.cger.nies.go.jp/gem/inter/GEMS/database/kasumi/index.html |
| Chl.a | Concentration of chlorophyll a | μg L-1 | Real number | 1 | http://db.cger.nies.go.jp/gem/inter/GEMS/database/kasumi/index.html |
| Ld | Daily total solar radiation | MJ m-2 d-1 | Real number | 1 |
http://www.data.jma.go.jp/obd/stats/etrn/index.php
(1981–1990) http://www.cger.nies.go.jp/db/kasumi/index.html (1991–2015) |
11. Supplementary Information
The data in this data paper represent part of the database of the Lake Kasumigaura Long-term Environmental Monitoring program. This monitoring has been conducted by the NIES since 1977, and the data in this data paper are fully identical to data that are reported on the Japanese ( http://db.cger.nies.go.jp/gem/inter/GEMS/database/kasumi/index.html ) and English ( http://db.cger.nies.go.jp/gem/moni-e/inter/GEMS/database/kasumi/index.html ) websites of the NIES, Japan.
The Lake Kasumigaura Long-term Environmental Monitoring program measures selected environmental variables (water temperature, water depth, transparency, dissolved oxygen, pH, and light irradiance in the water), water quality (EC, COD, Chl.a, SS, POC, PON, TP, DTP, SRP, TN, DTN, NH4–N, NO2–N+NO3–N, Al, B, Ba, Ca, Fe, K, Mg, Mn, Na, Si, Sr, and Cu), plankton communities (bacteria, HNFs, ciliates, picocyanobacteria, eukaryotic picoplankton, phytoplankton, rotifer, crustacean zooplankton, and mysids), benthic communities (chironomids and oligochaetes), and primary production. Data on the densities of bacteria, picophytoplankton, heterotrophic nanoflagellates and ciliates, monitored monthly since 1996, were published as a data paper by Takamura and Nakagawa (2012a), and data on the phytoplankton since 1978 were published as a data paper by Takamura and Nakagawa (2012b). A list of publications associated with the Lake Kasumigaura Long-term Environmental Monitoring program is shown on the following website: http://db.cger.nies.go.jp/gem/inter/GEMS/database/kasumi/contents/research.html.
12. Acknowledgements
Morihiro Aizaki, Senichi Ebise, Takehiko Fukushima, Toshio Iwakuma, Takayoshi Kawai, Noriko Takamura, Takayuki Hanazato, Yukihiro Nojiri, Masaaki Hosomi, Takanobu Inoue, Hideaki Ozawa, Akira Otsuki, Masayuki Yasuno, Akio Imai, Kazuho Inaba, Noriko Tomioka, Kazuhiro Iwasaki, Ayato Kohzu, Takayuki Satou, Kazuhiro Komatsu, Masami Koshikawa , Kazuo Matsushige, Ryuichiro Shinohara, Shin-ichiro Matsuzaki, Megumi Nakagawa, Ryuhei Ueno, Junko Yamamura and Tomiji Hagiwara performed the field survey. The publication of this data paper was encouraged by J-BON (Japan Biodiversity Observation Network) and partially supported by the Environmental Research and Technology Development Fund (S9) of the Ministry of the Environment, Japan (2011–2015) and JSPS KAKENHI Grant-in-Aid for Scientific Research (A) Number 15H02380 (2015–2018).
13. References
Beer C, Reichstein M, Tomelleri E, Ciais P, Jung M, Carvalhais N, Rödenbeck C, Arain MA, Baldocchi D, Bonan GB, Bondeau A, Cescatti A, Lasslop G, Lindroth A, Lomas M, Luyssaert S, Margolis H, Oleson KW, Roupsard O, Veenendaal E., Viovy N, Williams C, Woodward FI, Papale D (2010) Terrestrial gross carbon dioxide uptake: Global distribution and covariation with climate. Science 329:834-838
Bender ML, Grande K, Johnson K (1987) A comparison of four methods for determining planktonic community production. Limnol Oceanogr 32:1085-1098
Cadee GC, Hegeman J (2002) Phytoplankton in the Marsdiep at the end of the 20th century; 30 years monitoring biomass, primary production, and Phaeocystis blooms. J Sea Res 48:97-110
Cardinale BJ, Duffy JE, Gonzalez A, Hooper DU, Perrings C, Venail P, Narwani A, Mace GM, Tilman D, Wardle DA, Kinzig AP, Daily GC, Loreau M, Grace JB, Larigauderie A, Srivastava DS, Naeem S (2012) Biodiversity loss and its impact on humanity. Nature 486:59-67
Dickson ML, Orchardo J, Barber RT, Marra J, McCarthy JJ, Sambrotto RN (2001) Production and respiration rates in the Arabian Sea during the 1995 Northeast and southwest Monsoons. Deep-Sea Res II 48:1199-1230
González N, Gattuso JP, Middelburg JJ (2008) Oxygen production and carbon fixation in oligotrophic coastal bays and the relationship with gross and net primary production. Aquat Microb Ecol 52:119-130
Hama T, Miyazaki T, Ogawa Y, Iwakuma T, Takahashi M, Otsuki A, Ichimura S (1983) Measurement of photosynthetic production of marine phytoplankton population by using a stable 13C isotope. Mar Biol 73:31-36
Ichimura S (1958) On the photosynthesis of natural phytoplankton under field conditions. Bot Mag Tokyo 71:110-116
Ichimura S (1960a) Diurnal fluctuation of chlorophyll content in lake water. Bot Mag Tokyo 73:217-224
Ichimura S (1960b) Photosynthesis pattern of natural phytoplankton relating to light intensity. Bot Mag Tokyo 73:869-870
Ichimura S (1961) On the spatial difference of the primary production in the lake and its relation to environmental factors. Bot Mag Tokyo 74:6-13
Iwakuma T, Aizaki M (1979) Primary production at Takahamairi Bay in Lake Kasumigaura: Seasonal and summer diurnal changes. Res Rep Natl Inst Environ Stud 6:139-153 (in Japanese)
Iwakuma T, Yasuno M (1981) Characteristics of primary production in Lake Kasumigaura. Res Rep Natl Inst Environ Stud 22:99-122 (in Japanese)
Iwakuma T, Yasuno M (1983) A comparison of several mathematical equations describing photosynthesis-light curve for natural phytoplankton population. Arch Hydrobiol 97:208-226
Langdon C. Marra J, Knudson C (1995) Measurements of net and gross O2 production, dark O2 respiration, and 14C assimilation at the Marine Light-Mixed Layers site (59°N, 21°W) in the northeast Atlantic Ocean. J Geophys Res 100:6645-6653
Laws E, Sakshaug E, Babin M, Dandonneau Y, Falkowski P, Geider R, Legendre L, Morel A, Sondergaard M, Takahashi M, Williams P (2002) Photosynthesis and primary productivity in marine ecosystems: practical aspects and application of techniques. Jt Glob Ocean Flux Study Rep no 36
Marra J (2009) Net and gross productivity: weighing in with 14C. Aquat Microb Ecol 56:123-131
Maeda O, Iwamoto S, Yamaguchi Y (1974) Some consideration on eutrophication of Lake Kasumigaura. Jpn J Limnol 35:53-59 (in Japanese)
Marker AFH, Nusch EA, Rai H, Riemann B (1980) The measurement of photosynthetic pigments in freshwaters and standardization of methods: conclusions and recommendations. Arch Hydrobiol Beih. Ergeb Limnol 14:91-106
Otsuki A, Ino Y, Fujii T (1983) Simultaneous measurements and determinations of stable carbon and nitrogen isotope ratios, and organic carbon and nitrogen contents in biological samples by coupling of a small quadrupole mass spectrometer and modified carbon-nitrogen elemental analyzer. Int. J. Mass Spectrom. Ion Phys. 48:343-346
Otsuki A, Aizaki M, Iwakuma T, Takamura N, Hanazato T, Kawai T, Yasuno M (1985) Coupled transformation of inorganic stable carbon-13 and nitrogen-15 isotopes into higher trophic levels in a eutrophic shallow lake. Limnol Oceanogr 30:820-825
Riley GA (1939) Plankton studies, II. The Western North Atlantic, May-June, 1939. J Mar Res 2:145
Schulze ED (2006) Biological control of the terrestrial carbon sink. Biogeosciences 3:147-166
Smith EL (1936) Photosynthesis in relation to light and carbon dioxide. Proc Natl Acad Sci USA 22:504-511
Steemann-Nielsen E (1952) The use of radioactive carbon (14C) for measuring organic production in the sea. J Cons Int Explor Mer 18:117-140.
Stewart TJ, Sprules WG (2011) Carbon-based balanced trophic structure and flows in the offshore Lake Ontario food web before (1987-1991) and after (2001-2005) invasion-induced ecosystem change. Ecol Model 222:692-708
Takamura N (2012) The status of biodiversity loss in lakes and ponds in Japan. In: Nakano S, Yahara T, Nakashizuka T (eds) Biodiversity Observation Network in Asia-Pacific region: Towards further development of monitoring activities, Springer, Tokyo
Takamura N., Nakagawa M. (2012a) The densities of bacteria, picophytoplankton, heterotrophic nanoflagellates and ciliates in Lake Kasumigaura (Japan) monitored monthly since 1996. Ecol Res 27:839
Takamura N., Nakagawa M. (2012b) Phytoplankton species abundance in Lake Kasumigaura (Japan) monitored monthly or biweekly since 1978. Ecol Res 27:837
Takamura N, Aizaki M (1991) Changes in primary production in Lake Kasumigaura (1986—1989) accompanied by transition of dominant species. Jpn J Limnol 52:173-187
Takamura, N., Iwakuma, T. and Yasuno, M. (1985): Photosynthesis and primary production of Microcystis aeruginosa Kütz. in Lake Kasumigaura. J. Plankton Res 7: 303-312
Takamura, N., Iwakuma, T. and Yasuno, M. (1987): Primary production in Lake Kasumigaura, 1981—1985. Jpn J Limnol S13-S38
Takamura N, Iwakuma T, Yasuno M (1986) Photosysnthesis of size-fractionated phytoplankton population in hypertrophic Lake Kasumigaura, Japan. Arch Hydrobiol 108:235-257
Takamura N, Otsuki A, Aizaki M, Nojiri Y (1992) Phytoplankton species shift accompanied with transition from nitrogen dependence to phosphorus dependence of primary productioon In Lake Kasumigaura, Japan. Arch Hydrobiol 124:129-148
Tezuka Y, Watanabe Y, Hayashi H, Aizaki M, Maruyama T (1973) Water quality, biomass of bacteria, and the primary production. Biological surv rep of Lake Kasumigaura (in Japanese)
Tezuka Y, Hayashi H, Amzaki M, Nakazima T, Ochiai M, Nakamoto N, Kono T (1975) Bacterial biomass and primary production. Biological surv rep of Lake Kasumigaura (in Japanese)
UNESCO/SCOR (1966) Determination of photosynthetic pigments in seawater. UNESCO, Paris
Vollenweider RA (1974) Environ factors linked with primary production. In: Vollenweider RA (ed) A manual on methods for measuring primary production in aquatic environments, Blackwell Scientific Pulications, Oxford
Weger HG, Herzig R, Falkowski P, Turpin DH (1989) Respiration losses in the light in a marine diatom: measurements by short-term mass spectrometry. Limnol Oceanogr 34: 1153-1161
