Metadata
Title
Biogeochemical nitrogen properties of forest soils in the Japanese archipelago
Authors
Rieko Urakawa 1,*, Nobuhito Ohte 2, Hideaki Shibata 3, Ryunosuke Tateno 4, Takuo Hishi 5, Keitaro Fukushima 6, Yoshiyuki Inagaki 7, Keizo Hirai 8, Tomoki Oda 9, Nobuhiro Oyanagi 10, Makoto Nakata 11, Hiroto Toda 12, Tanaka Kenta 13, Karibu Fukuzawa 14, Tsunehiro Watanabe 15, Naoko Tokuchi 4, Tatsuro Nakaji 16, Nobuko Saigusa 17, Yukio Yamao 17, Asami Nakanishi 4, Tsutomu Enoki 5, Shin Ugawa 18, Atsushi Hayakawa 19, Ayumi Kotani 20, Megumi Kuroiwa 21, Kazuo Isobe 9
- 1 Asia Center for Air Pollution Research, Japan Environmental Sanitation Center, 1182 Sowa, Nishi-ku, Niigata 950-2144, Japan
- 2 Graduate School of Informatics, Kyoto University, Yoshida-Honmachi, Sakyo-ku, Kyoto, 606-8501, Japan
- 3 Field Science Center for Northern Biosphere, Hokkaido University, N9 W9, Kita-ku, Sapporo, Hokkaido 060-0809, Japan
- 4 Field Science Education and Research Center, Kyoto University, Oiwake-cho, Kitashirakawa, Sakyo-ku, Kyoto 606-8502, Japan
- 5 Graduate School of Agriculture, Kyushu University, 394 Tsubakuro, Sasagurimachi, Kasuya, Fukuoka 811-2415, Japan
- 6 Graduate School of Urban Environmental Sciences, Tokyo Metropolitan University, 1-1 Minamiohsawa, Hachiohji, Tokyo 192-0397, Japan
- 7 Shikoku Research Center, Forestry and Forest Products Research Institute, 2-915 Asakura-Nishimachi, Kochi 780-8077, Japan
- 8 Forestry and Forest Products Research Institute, 1 Matsunosato, Tsukuba, Ibaraki 305-8687, Japan
- 9 Graduate School of Agricultural and Life Sciences, The University of Tokyo, 1-1-1 Yayoi, Bunkyo-ku, Tokyo 113-8657, Japan
- 10 Environmental Science Research Niigata, 8-13 Yoshidahigashisakae-cho, Tsubame, Niigata 959-0291, Japan
- 11 Faculty of Agriculture, Niigata University, 2-8050 Ikarashi, Nishi-ku, Niigata 950-2181, Japan
- 12 Graduate School of Agriculture, Tokyo University of Agriculture and Technology, 3-5-8 Saiwai-cho, Fuchu, Tokyo 183-8509, Japan
- 13 Sugadaira Montane Research Center, University of Tsukuba, 1278-294 Sugadairakougen, Ueda, Nagano 386-2204, Japan
- 14 Northern Forestry and Development Office, Field Science Center for Northern Biosphere, Hokkaido University, 250 Tokuda, Nayoro, Hokkaido 096-0071, Japan
- 15 Hokkaido Forest Research Station, Field Science Education and Research Center, Kyoto University, 553 Tawa, Kawakami-gun, Shibecha-cho, Hokkaido 088-2339, Japan
- 16 Tomakomai Research Station, Field Science Center for Northern Biosphere, Hokkaido University, Takaoka, Tomakomai, Hokkaido 053-0035, Japan
- 17 Center for Global Environmental Research, National Institute for Environmental Studies, 16-2 Onogawa, Tsukuba, Ibaraki 305-8506, Japan
- 18 Faculty of Agriculture, Kagoshima University, 1-21-24 Korimoto, Kagoshima 890-0065, Japan
- 19 Department of Biological Environment, Akita Prefectural University, 241-438 Nakano-aza-kaidobata, Shimoshinjo, Akita 010-0195, Japan
- 20 Graduate School of Bioagricultural Sciences, Nagoya University, Furo-cho, Chikusa-ku, Nagoya 464-8601, Japan
- 21 Faculty of Science and Engineering, Chuo University, 1-13-27 Kasuga, Bunkyo-ku, Tokyo 112-8551, Japan
*Corresponding author: Rieko Urakawa
Address:
1182 Sowa, Nishi-ku, Niigata 950-2144, Japan
Tel.: +81-25-263-0560
Fax: +81-25-263-0567
E-mail address:
urakawa@acap.asia, rieko@y7.dion.ne.jp
Abstract
This data paper provides some biogeochemical nitrogen (N) properties and related chemical properties of forest soils from 43 sites throughout the Japanese archipelago. The data set was collected and analyzed under the GRENE (Green Network of Excellence) environmental information project and the ReSIN (Regional and comparative Soil Incubation study on Nitrogen dynamics in forest ecosystems) project. The sites cover 44° 20′ N to 26° 50′ N and the climate ranges from cool-temperate zone to subtropical zone. At each site, litter on forest floor and soil samples (three or four layers to 50 cm depth) were collected between August and November in 2010–2015 from five soil profiles. From the litter layer samples, the stocks and concentrations of total carbon (C) and N were measured. From the mineral soil samples, bulk density, pH (H2O), total C and N concentrations, net and gross rates of N mineralization, nitrification and concentrations of water-soluble substances were measured. The measurements are relevant for other biogeochemical N studies in forest ecosystems and the data set provides basic information on the N pool and fluxes with related chemical properties of forest soils across the Japanese archipelago.
The average rates of net and gross N transformation at 20℃ across the sites were 0.26 ± 0.47 mgN kg-1 soil d-1 for net N mineralization, 0.25 ± 0.45 mgN kg-1 soil d-1 for net nitrification, 4.06 ± 0.47 mgN kg-1 soil d-1 for gross N mineralization, and 1.03 ± 1.29 mgN kg-1 soil d-1 for gross nitrification (average ± SD).
Keywords
- gross nitrogen transformation rate
- litter layer stock
- net nitrogen transformation rate
- nitrification
- nitrogen cycle
- nitrogen mineralization
- the Japanese archipelago
- total carbon and nitrogen concentrations
- water-soluble ions
- water-soluble organic carbon
Introduction
The Japanese archipelago extends for ~3,000 km and the climatic zones range from cool-temperate to subtropical. This means the forest types and vegetation are rich in diversity and the soil biogeochemical cycles, which are generated under these highly varied climate and vegetation conditions, vary widely. Previous studies surveying forest soil properties with common methods are quite limited and no integrated dataset has been available in Japan. This suggests that data conditions for meta-analysis or model simulations that consider the effect of climate change on material cycles in forest ecosystems of Japan are not sufficient.
There are several large-scale surveys on biogeochemical nitrogen cycles in Europe and the United States such as the NITREX project (Wright and van Breemen 1995), continental-scale analysis of soils in North America and the islands of Puerto Rico and Hawaii (Fierer et al. 2006; Coleman and Schimel 2013), and the NEON Soil Archive (The National Ecological Observatory Network 2013). Also in Japan, large scale soil survey and material cycling research were conducted back in the 1940s till 1970s. Forest Soil Survey (Government forest experiment station 1951), which was the first comprehensive survey of the Japanese forest soil, reported not only the soil classification, but also physical and chemical properties of soil all over Japan. In addition, material cycling in the various forest ecosystems in Japan were addressed as part of the International Biological Program (Kira et al. 1978). However, these two large-scale survey did not consider for the secondary use of the large amounts of dataset. For further utilizing of the dataset collected by such large-scale survey, it is necessary to organize the dataset as a database which is highly accessible and processable.
The recent progress in the soil biochemical analysis enabled us to obtain more direct and precise indices of the nutrient cycling in the forest soils such as gross nitrogen (N) transformation rates by 15N isotope-dilution technique (Isobe et al. 2011a). To improve the quality of the dataset, it is important to apply these new techniques at developing a new database.
In this data paper, some biogeochemical nitrogen properties of forest soils from 43 sites throughout the Japanese archipelago are provided. The sites cover from 44° 20′ N to 26° 50′ N and the climatic zones range from cool-temperate to subtropical. At each site, the litter on forest floor and mineral soil (three or four layers to 50 cm depth) were sampled between August and November from five soil profiles. For the litter layer, the organic matter amount and total carbon (C) and N concentrations were measured. For the mineral soil, the bulk density, pH (H2O), total C and N concentrations, net and gross rates of N mineralization, nitrification and concentrations of water-soluble substances were measured.
This survey was initiated as a basic research for the ReSIN (Regional and comparative Soil Incubation study on Nitrogen dynamics in forest ecosystems) project, and part of the dataset was reported in Shibata et al. (2011), Kuroiwa et al. (2011) and Urakawa et al. (2014). To enrich the quality and quantity of the dataset, an additional 33 sites were studied in the GRENE (Green Network of Excellence) environmental information project. The measurement is relevant for the biogeochemical studies in the forest ecosystems and this dataset provides basic information on forest soils in the Japanese archipelago.
Metadata
1. Title
Biogeochemical nitrogen properties of forest soils in the Japanese archipelago
2. Identifier
ERDP-2014-02
3. Contributor
3.A. Dataset owners
Rieko Urakawa
Asia Center for Air Pollution Research, Japan Environmental
Sanitation Center
Address:
1182 Sowa, Nishi-ku, Niigata 950-2144, Japan
Tel.: +81-25-263-0560
Fax: +81-25-263-0567
E-mail address:
urakawa@acap.asia, rieko@y7.dion.ne.jp
Nobuhito Ohte
Graduate School of Informatics, Kyoto University
Address:
Yoshida-Honmachi, Sakyo-ku, Kyoto, 606-8501, Japan
Tel.: +81-75-753-3134
Fax: +81-75-753-3133
E-mail address:
nobu@bre.soc.i.kyoto-u.ac.jp
3.B. Contact person
| Site | Contact person | Affiliation | Address | |
|---|---|---|---|---|
| URA, URN | Karibu Fukuzawa | caribu@fsc.hokudai.ac.jp | Northern Forestry and Development Office, Field Science Center for Northern Biosphere, Hokkaido University | 250 Tokuda, Nayoro, Hokkaido 096-0071, Japan |
| Tsunehiro Watanabe | watanabetsune@gmail.com | Hokkaido Forest Research Station, Field Science Education and Research Center, Kyoto University | 553 Tawa, Kawakami-gun, Shibecha-cho, Hokkaido 088-2339, Japan | |
| Hideaki Shibata | shiba@fsc.hokudai.ac.jp | Southern Forestry and Development Office, Field Science Center for Northern Biosphere, Hokkaido University | N9 W9, Kita-ku, Sapporo, Hokkaido 060-0809, Japan | |
| SCB, SCC | Ryunosuke Tateno | rtateno@kais.kyoto-u.ac.jp | Field Science Education and Research Center, Kyoto University | Oiwake-cho, Kitashirakawa, Sakyo-ku, Kyoto 606-8502, Japan |
| ARR | Takuo Hishi | hishi@forest.kyushu-u.ac.jp | Graduate School of Agriculture, Kyushu University | 394 Tsubakuro, Sasagurimachi, Kasuya, Fukuoka 811-2415, Japan |
| ARB, ARC | Takuo Hishi | hishi@forest.kyushu-u.ac.jp | Graduate School of Agriculture, Kyushu University, | 394 Tsubakuro, Sasagurimachi, Kasuya, Fukuoka 811-2415, Japan |
| Ryunosuke Tateno | rtateno@kais.kyoto-u.ac.jp | Field Science Education and Research Center, Kyoto University | Oiwake-cho, Kitashirakawa, Sakyo-ku, Kyoto 606-8502, Japan | |
| TMC, TMN | Naoko Tokuchi | tokuchi@kais.kyoto-u.ac.jp | Field Science Education and Research Center, Kyoto University | Oiwake-cho, Kitashirakawa, Sakyo-ku, Kyoto 606-8502, Japan |
| Tatsuro Nakaji | nakaji@fsc.hokudai.ac.jp | Tomakomai Research Station, Field Science Center for Northern Biosphere, Hokkaido University | Takaoka, Tomakomai, Hokkaido 053-0035, Japan | |
| APN, MRB, KTA, KTB | Yoshiyuki Inagaki | yinagaki@affrc.go.jp | Shikoku Research Center, Forestry and Forest Products Research Institute | 2-915 Asakuranishi-cho, Kochi 780-8077, Japan |
| Keizo Hirai | hirai@ffpri.affrc.go.jp | Forestry and Forest Products Research Institute | 1 Matsunosato, Tsukuba, Ibaraki 305-8687, Japan | |
| AKA | Atsushi Hayakawa | hayakawa@akita-pu.ac.jp | Department of Biological Environment, Akita Prefectural University | 241-438 Nakano-aza-kaidobata, Shimoshinjo, Akita 010-0195, Japan |
| Keitaro Fukushima | ktaro.f@gmail.com | Graduate School of Urban Environmental Sciences, Tokyo Metropolitan University | 1-1 Minamiohsawa, Hachiohji, Tokyo 192-0397, Japan | |
| SGA, SGN, KKN | Nobuhiro Oyanagi | oyanagi0009@gmail.com | Environmental Science Research Niigata | 8-13 Yoshidahigashisakae-cho, Tsubame, Niigata 959-0291, Japan |
| Makoto Nakata | nakata@agr.niigata-u.ac.jp | Graduate School of Agriculture, Niigata University | 2-8050 Ikarashi, Nishi-ku, Niigata 950-2181, Japan | |
| KSN, OYB, OYC | Hiroto Toda | todah@cc.tuat.ac.jp | Institute of Agriculture, Tokyo University of Agriculture and Technology | 3-5-8 Saiwai-cho, Fuchu, Tokyo 183-8509, Japan |
| Rieko Urakawa | urakawa@acap.asia | Asia Center for Air Pollution Research, Japan Environmental Sanitation Center | 1182 Sowa, Nishi-ku, Niigata 950-2144, Japan | |
| SDP, SDB, SDG | Tanaka Kenta | kenta@sugadaira.tsukuba.ac.jp | Sugadaira Montane Research Center, University of Tsukuba | 1278-294 Sugadairakougen, Ueda, Nagano 386-2204, Japan |
| FKA, FKB, TZA, TZB | Tomoki Oda | oh-dah@fr.a.u-tokyo.ac.jp | Graduate School of Agricultural and Life Sciences, The University of Tokyo | 1-1-1 Yayoi, Bunkyo-ku, Tokyo 113-8657, Japan |
| FJF, FJS | Nobuko Saigusa | n.saigusa@nies.go.jp | Center for Global Environmental Research, National Institute for Environmental Studies | 16-2 Onogawa, Tsukuba, Ibaraki 305-8506, Japan |
| Yukio Yamao | yamao.yukio@nies.go.jp | |||
| STN | Ayumi Kotani | kotani@agr.nagoya-u.ac.jp | Graduate School of Bioagricultural Sciences, Nagoya University | Furocho, Chikusa-ku, Nagoya 464-8601, Japan |
| ASA, ASN | Keitaro Fukushima | ktaro.f@gmail.com | Graduate School of Urban Environmental Sciences, Tokyo Metropolitan University | 1-1 Minamiohsawa, Hachiohji, Tokyo 192-0397, Japan |
| Ryunosuke Tateno | rtateno@kais.kyoto-u.ac.jp | Field Science Education and Research Center, Kyoto University | Oiwake-cho, Kitashirakawa, Sakyo-ku, Kyoto 606-8502, Japan | |
| KGB, KGC | Asami Nakanishi | asa@kais.kyoto-u.ac.jp | Field Science Education and Research Center, Kyoto University | Oiwake-cho, Kitashirakawa, Sakyo-ku, Kyoto 606-8502, Japan |
| SBA, SBN | Tsutomu Enoki | enoki@forest.kyushu-u.ac.jp | Graduate School of Agriculture, Kyushu University | 394 Tsubakuro, Sasagurimachi, Kasuya, Fukuoka 811-2415, Japan |
| Takuo Hishi | hishi@forest.kyushu-u.ac.jp | |||
| TKA, TKN | Shin Ugawa | ushin@agri.kagoshima-u.ac.jp | Faculty of Agriculture, Kagoshima University | 1-21-24 Korimoto, Kagoshima 890-0065, Japan |
| Ryunosuke Tateno | rtateno@kais.kyoto-u.ac.jp | Field Science Education and Research Center, Kyoto University | Oiwake-cho, Kitashirakawa, Sakyo-ku, Kyoto 606-8502, Japan | |
| YNN | Keitaro Fukushima | ktaro.f@gmail.com | Graduate School of Urban Environmental Sciences, Tokyo Metropolitan University | 1-1 Minamiohsawa, Hachiohji, Tokyo 192-0397, Japan |
| HZA, HZB | Muneto Hirobe | mhirobe@okayama-u.ac.jp | Graduate School of Environmental and Life Science, Okayama University | 1-1-1 Tsushimanaka, Okayama 700-8530, Japan |
| Yuko Miyazaki | yukomiyazaki@okayama-u.ac.jp | |||
| TTA, TTB | Yoshiyuki Inagaki | yinagaki@affrc.go.jp | Shikoku Research Center, Forestry and Forest Products Research Institute | 2-915 Asakuranishi-cho, Kochi 780-8077, Japan |
4. Geographical coverage
4.A. Geographic description
Japan
4.B. Boundary coordinates
(Geographic coordinate system, WGS84)
West: 128° 13′ 05″
East: 144° 39′ 36″
North: 44° 21′ 44″
South: 26° 45′ 09″
5. Temporal coverage
The earliest sampling date: Aug 2nd, 2010 (at KSN)
The latest sampling date: Nov 13th, 2015 (at TTA and TTB)
6. Methods
6.A. Sampling sites
The soils and litter layers were collected from 43 sites in 23 regions throughout the Japanese archipelago (Fig. 1). Site name, abbreviation and geographic coordinates of the soil sampling sites are shown in Table 1. An experimental plot (~20 × 20 m) was established at each site and five sampling locations were established in a pattern corresponding to the five-spot on a dice. Soil and litter layer samples were collected at each sampling location in either summer or autumn in 2010 to 2015 and analyzed according to the methods described below.
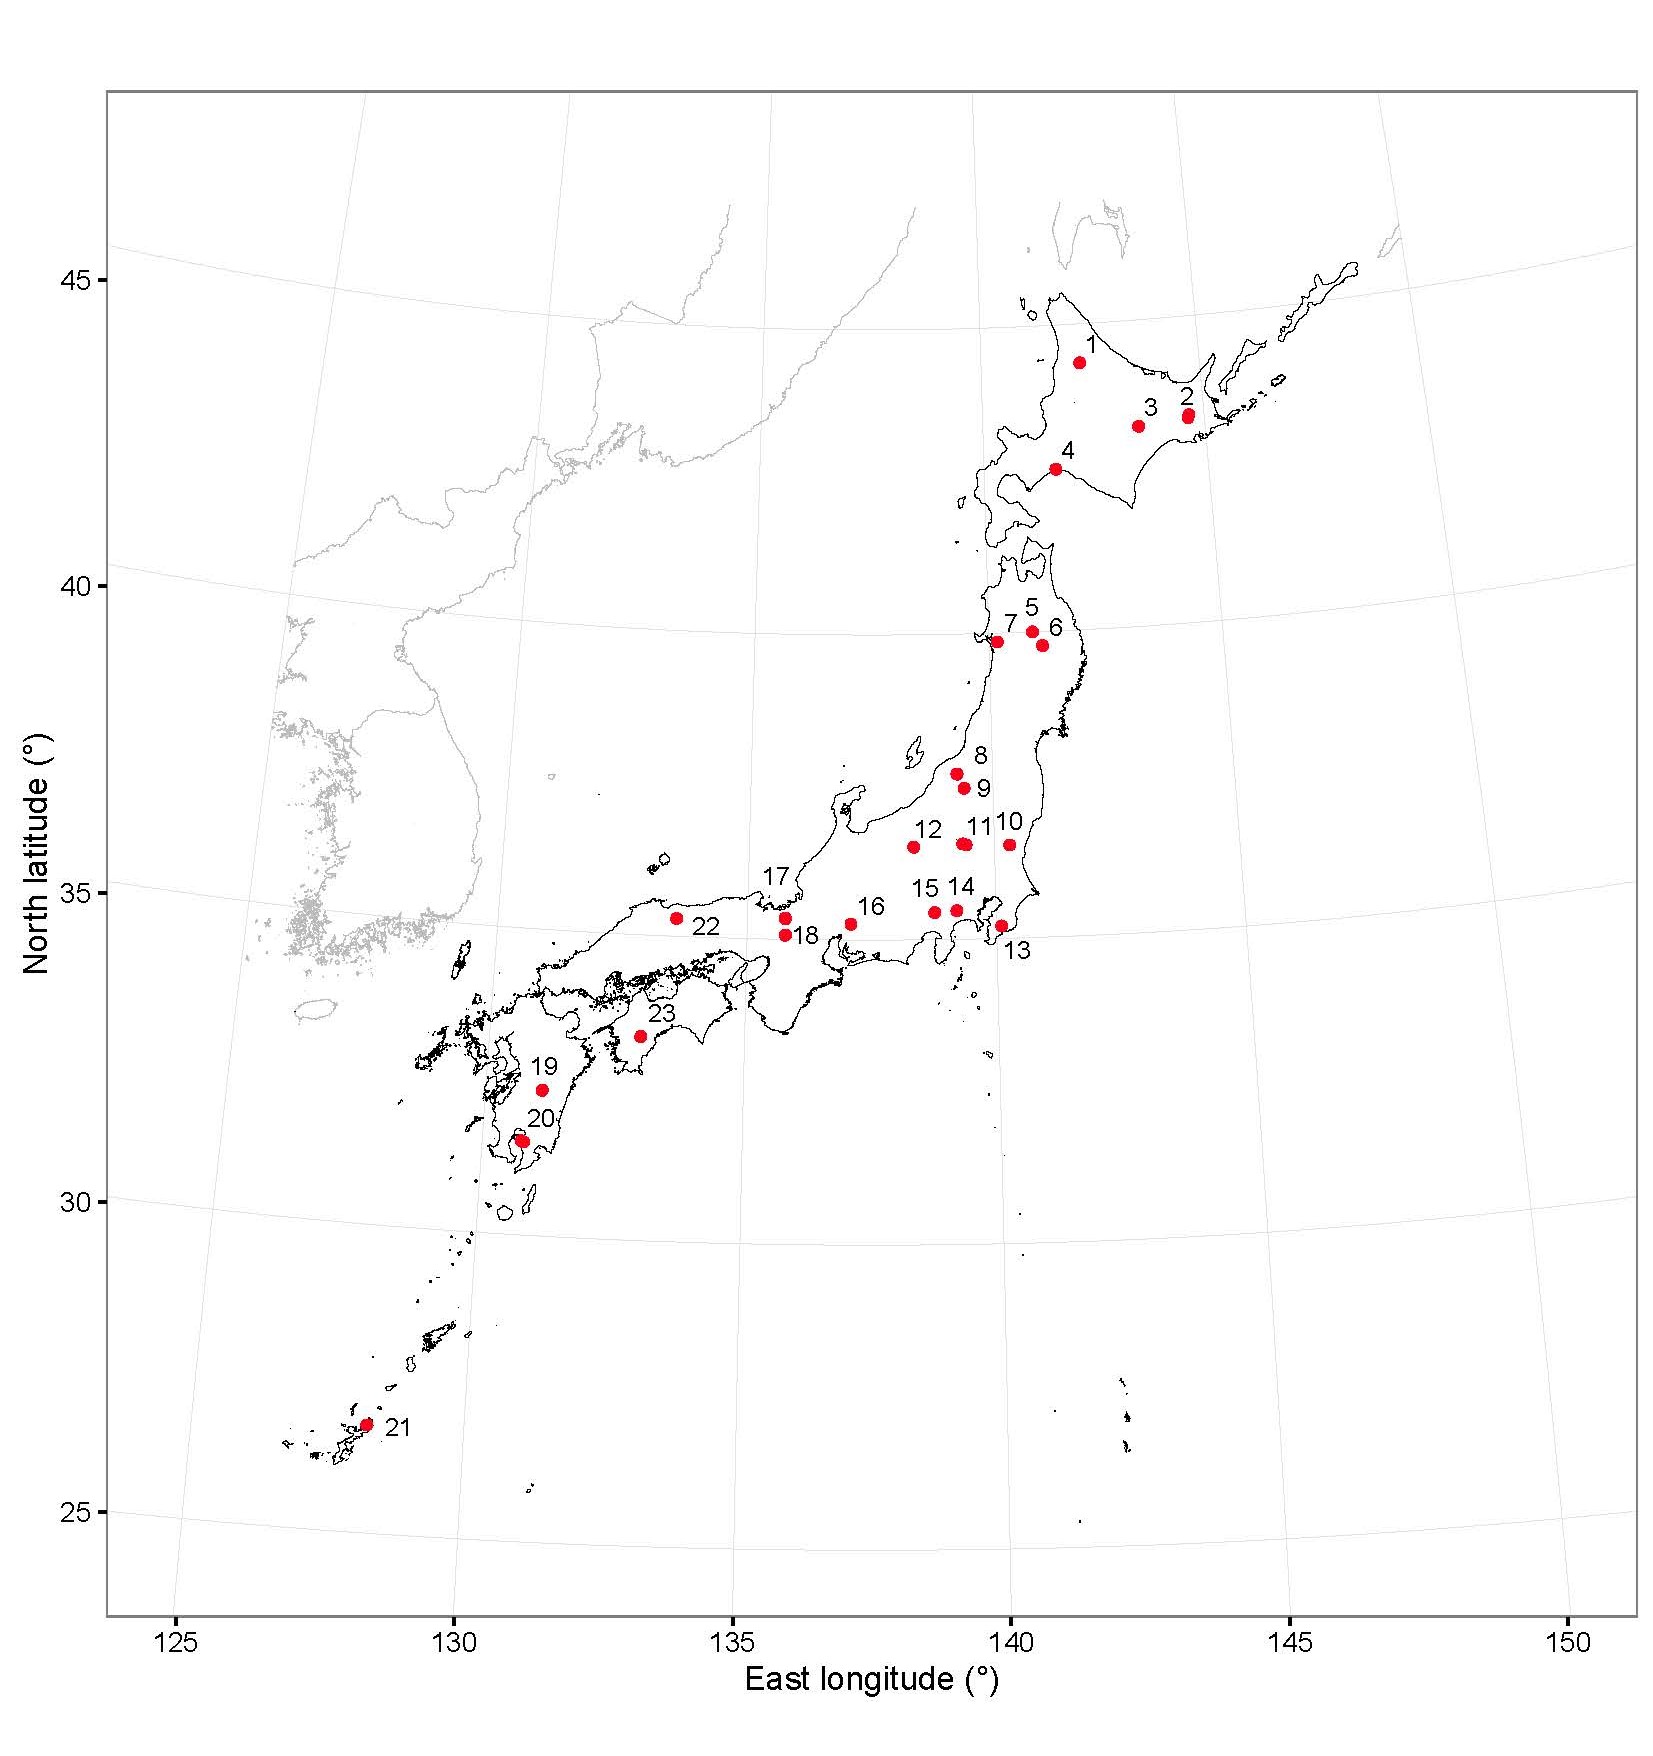
Table 1 . Names and locations of the soil and litter layer sampling sites.
| No. of the map (Fig. 1) | Site | Abbreviation | North latitude | East longitude |
|---|---|---|---|---|
| 1 | Uryu, artificial coniferous forest | URA | 44° 22' 2'' N | 142° 14' 48'' E |
| 1 | Uryu, natural mixed forest | URN | 44° 21' 21'' N | 142° 15' 29'' E |
| 2 | Shibecha, broadleaved forest | SCB | 43° 23' 17'' N | 144° 39' 36'' E |
| 2 | Shibecha, coniferous forest | SCC | 43° 20' 33'' N | 144° 38' 3'' E |
| 3 | Ashoro, broadleaved forest-ReSIN | ARR | 43° 15' 50'' N | 143° 30' 28'' E |
| 3 | Ashoro, broadleaved forest | ARB | 43° 19' 25'' N | 143° 30' 25'' E |
| 3 | Ashoro, coniferous forest | ARC | 43° 19' 23'' N | 143° 31' 2'' E |
| 4 | Tomakomai, control | TMC | 42° 42' 11'' N | 141° 34' 17'' E |
| 4 | Tomakomai, N addition | TMN | 42° 42' 1'' N | 141° 34' 14'' E |
| 5 | Appi, natural forest | APN | 40° 0' 5'' N | 140° 56' 12'' E |
| 6 | Morioka, broadleaved forest | MRB | 39° 46' 13'' N | 141° 8' 25'' E |
| 7 | Akita, artificial forest | AKA | 39° 51' 21'' N | 140° 10' 35'' E |
| 8 | Sugana, artificial forest | SGA | 37° 42' 34'' N | 139° 15' 35'' E |
| 8 | Sugana, natural forest | SGN | 37° 42' 26'' N | 139° 15' 52'' E |
| 9 | Kamikawa, natural forest | KKN | 37° 28' 23'' N | 139° 24' 14'' E |
| 10 | Katsura, artificial forest | KTA | 36° 31' 32'' N | 140° 18' 38'' E |
| 10 | Katsura, broadleaved forest | KTB | 36° 31' 32'' N | 140° 18' 38'' E |
| 11 | Kusaki, natural forest | KSN | 36° 32' 45'' N | 139° 25' 16'' E |
| 11 | Oyasan, old-aged artificial forest | OYB | 36° 33' 47'' N | 139° 21' 8'' E |
| 11 | Oyasan, young-aged artificial forest | OYC | 36° 33' 44'' N | 139° 21' 13'' E |
| 12 | Sugadaira, pine forest | SDP | 36° 31' 21'' N | 138° 21' 0'' E |
| 12 | Sugadaira, broadleaved forest | SDB | 36° 31' 9'' N | 138° 21' 7'' E |
| 12 | Sugadaira, grassland | SDG | 36° 31' 24'' N | 138° 20' 59'' E |
| 13 | Fukuroyamasawa-A | FKA | 35° 12' 20'' N | 140° 6' 11'' E |
| 13 | Fukuroyamasawa-B | FKB | 35° 12' 18'' N | 140° 6' 11'' E |
| 14 | Tanzawa-A | TZA | 35° 28' 8'' N | 139° 12' 33'' E |
| 14 | Tanzawa-B | TZB | 35° 28' 16'' N | 139° 12' 42'' E |
| 15 | Fujihokuroku-1 | FJF | 35° 26' 39'' N | 138° 45' 49'' E |
| 15 | Fujihokuroku-2 | FJS | 35° 26' 39'' N | 138° 45' 48'' E |
| 16 | Seto, flux site | STN | 35° 15' 41'' N | 137° 4' 43'' E |
| 17 | Ashiu, artificial forest | ASA | 35° 20' 4.3'' N | 135° 45' 35.8'' E |
| 17 | Ashiu, natural forest | ASN | 35° 21' 4'' N | 135° 45' 25'' E |
| 18 | Kamigamo, broadleaved forest | KGB | 35° 4' 13'' N | 135° 46' 3'' E |
| 18 | Kamigamo, coniferous forest | KGC | 35° 4' 1'' N | 135° 45' 52'' E |
| 19 | Shiiba, artificial forest | SBA | 32° 22' 44'' N | 131° 5' 45'' E |
| 19 | Shiiba, natural forest | SBN | 32° 22' 35'' N | 131° 5' 50'' E |
| 20 | Takakuma, artificial forest | TKA | 31° 31' 11'' N | 130° 47' 42'' E |
| 20 | Takakuma, natural forest | TKN | 31° 32' 7'' N | 130° 45' 4'' E |
| 21 | Yona, natural forest | YNN | 26° 45' 9'' N | 128° 13' 5'' E |
| 22 | Hiruzen, artificial forest | HZA | 35° 17' 28'' N | 133° 34' 41'' E |
| 22 | Hiruzen, natural forest | HZB | 35° 17' 28'' N | 133° 34' 40'' E |
| 23 | Takatoriyama, artificial forest | TTA | 33° 20' 7'' N | 132° 57' 40'' E |
| 23 | Takatoriyama, natural forest | TTB | 33° 20' 19'' N | 132° 57' 50'' E |
6.B. Litter layer
6.B.1. Litter layer stock
At the five sampling locations in each site, litter layer samples were collected from inside a 50 × 50 cm frame and then sorted into three categories: L layer-branch (branches in the fresh litter layer), L layer-leaves (leaves in the fresh litter layer) and FH layer (decomposed litter layer). Samples were weighed after drying at 70°C for 48 h.
6.B.2. Total C and N concentrations of litter layer
Total carbon (C) and nitrogen (N) concentrations in each category of the litter layer were measured using a CN analyzer (MT-500, Yanaco Technical Science Corp., Tokyo, Japan) or a CHN analyzer (Flash EA 1112, Thermo Fisher Scientific Inc., Waltham, MA, USA) after drying at 70°C for 48 h and grinding.
6.C. Mineral soil layer
6.C.1. Soil sampling
At the five sampling locations in each site, soil profiles (~50 cm depth) were established. Mineral soil samples were collected from three (0–10, 10–30 and 30–50 cm) or four (0–10, 10–20, 20–30 and 30–40 cm) depths. Soil samples were stored in plastic bags in a cool box and transported to the laboratory by a carrying company at 1‒4℃.
6.C.2. Bulk density
After soil pits were excavated, soil samples were collected using a 100 cm3 cylindrical sampler from three (5, 20, 40 cm) or four (5, 15, 25, 35 cm) depths. Soil samples were sorted into fine soil (≤2 mm), coarse gravel (>2 mm) and roots and weighed after drying at 105℃ for 24 h.
6.C.3. Gravimetric water content
Immediately after the soil samples arrived at the laboratory, the gravimetric water content was measured by drying ~20 g sub samples at 105℃ for 24 h.
6.C.4. pH (H2O)
Soil pH (H2O) was measured using a glass electrode (HM-7E, DKK-TOA Corp., Tokyo, Japan) after water extraction for 1 h (fresh soil : deionized water = 20 g : 25 mL, which approximately corresponds to dry soil : water = 1 : 2.5 (Japanese Society of Soil Science and Plant Nutrition 1997)).
6.C.5. Total C and N concentrations
The total C and N concentrations of the mineral soils were measured using an NC analyzer (Sumigraph NC-22, Sumika Chemical Analysis Service Ltd., Osaka, Japan) or CHN analyzer (Flash EA 1112, Thermo Fisher Scientific Inc.) after air drying and grinding.
6.C.6. Inorganic N concentrations
For the 10 selected sites (URN, ARR, APN, MRB, SGN, KSN, ASN, KGC, SBN, TKN), soil inorganic N (NH4‒N and NO3‒N) was extracted immediately after the soils arrived at the laboratory. For the remaining sites, inorganic N was extracted at the beginning of the net N mineralization rate measurement (see C-8) as the initial state. Soil extraction was conducted with 2 M KCl solution (fresh soil: 2 M KCl solution = 1: 10, shaking for 1 h). The extracts were filtered using filter paper (No. 5B, Advantec Toyo Kaisha Ltd., Tokyo, Japan) and frozen until analysis. The NH4‒N concentration in the extracts was measured by the indophenol method and the NO3‒N concentration in the extracts was measured by the sulfanilamide-naphthylethylenediamine method after reduction by a Cd-Cu column. Both colorimetric methods used a flow injection system (FIU-300; Jasco Corp., Tokyo, Japan).
6.C.7. Water-soluble substance concentrations
Soil samples were extracted by deionized water (fresh soil: deionized water = 1: 5, shaking 1 h). The extracts were then centrifuged at 3500rpm for 10 min, filtered by glass fiber filters (GF/F; Whatman Int. Ltd., Maidstone, Kent, UK) and frozen until analysis. Water-soluble organic carbon (WSOC) concentration was measured by a TOC meter (TOC-VCPH, Shimadzu Corp., Kyoto, Japan). Water-soluble cation (sodium (Na+), ammonium (NH4+), potassium (K+), magnesium (Mg2+) and calcium (Ca2+)) and anion (chloride (Cl-), nitrate (NO3-) and sulfate (SO42-)) concentrations were measured by ion chromatography (DX-500 or ICS-1100, Thermo Fisher Scientific Inc.). Water-soluble aluminum (Al), iron (Fe), manganese (Mn) and copper (Cu) concentrations were measured by ICP-AES (IRIS Advantage, Thermo Fisher Scientific Inc.).
6.C.8. Net N transformation rates
The mineral soils used for the measurement of net N mineralization and nitrification rates were collected from the soil profiles as described in C-1; from 0–10, 10–30 and 30–50-cm depths in the five sampling locations at each site. Soils were sieved to 4 mm to remove coarse roots and gravels. Soils from the same depth were mixed together to make ~500 g of pooled sample. Soil samples were then transported from the sites to the laboratory by private carrier at 1–4℃. In the laboratory, soils were divided into four proportions (~100 g each, for initial extraction, and 15, 20 and 25 ℃ incubation) and subsamples for the 15, 20 and 25℃ incubations were contained in plastic bags with a zipper (0.04 mm thick, Unipack G-4, Seisan-Nihonsha Corp., Tokyo, Japan) in a tight seal to prevent drying. Incubation was conducted for 4 weeks using three laboratory incubators (IN61 and IN600, Yamato Scientific Co., Ltd., Tokyo, Japan). No moisture adjustment was made during the incubation; soil was incubated under the initial moisture content at field sampling. The moisture loss during the incubation was lower than 2% in the gravimetric water content. The initial and incubated soil extraction was conducted with three replications. Methods for extraction, filtration and concentration analysis are the same as C-6.
The net N mineralization rate for each temperature was derived by the equation below:
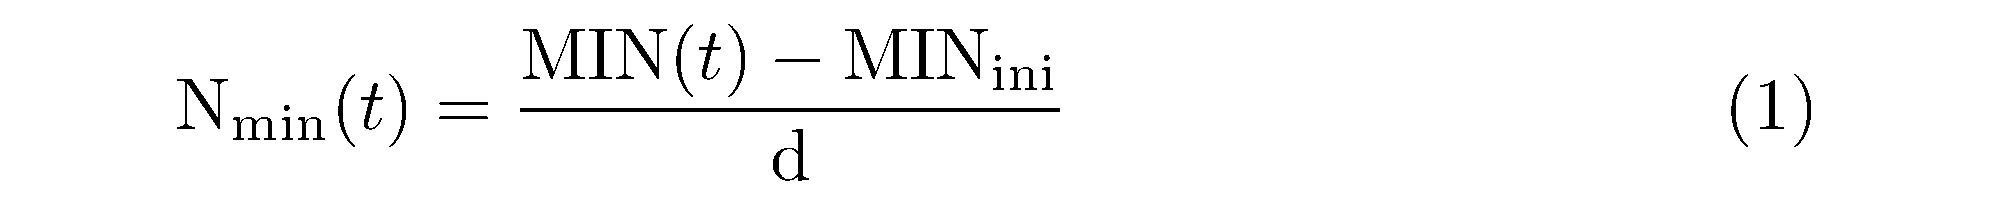
where Nmin(t) (mgN kg-1 d-1) is the net N mineralization rate at the incubation temperature t (℃); MIN(t) is the inorganic N (NH4‒N + NO3‒N) concentration (mgN kg-1) after the incubation at temperature t; MINini is the initial inorganic N concentration (mgN kg-1); and d is the incubation days (d).
The net nitrification rate for each temperature was derived by the equation as follows:
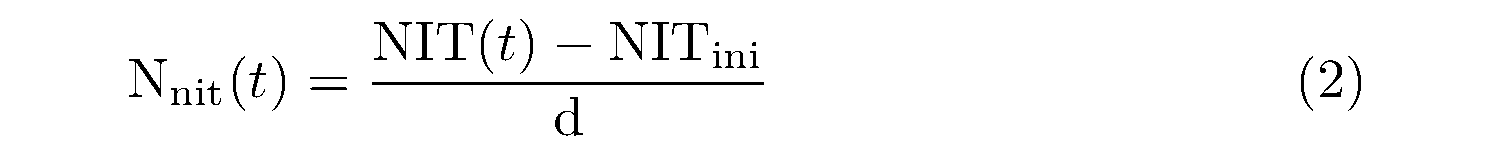
where Nnit(t) (mgN kg-1 d-1) is the net nitrification rate at the incubation temperature t (℃); NIT(t) is the nitrate (NO3-N) concentration (mgN kg-1) after the incubation at temperature t; and NITini is the initial NO3-N concentration (mgN kg-1).
Based on the Arrhenius equation, the net N mineralization rate at given temperatures is presented as below (Sierra 1997):
where Nmin is the net N mineralization rate (mgN kg-1 d-1); Nmin0 is the parameter describing net N mineralization rate at 0℃ (mgN kg-1 d-1); and βmin (no unit) is also the parameter indicating the dependency on the temperatures of net N mineralization rates.
By fitting the relationship between temperature and net N mineralization rates at the three temperatures to equation (3), Nmin0 and βmin were estimated.
In the same way, the net nitrification rate at given temperatures is presented as follows:
where Nnit is the net nitrification rate (mgN kg-1 d-1); Nnit0 is the parameter describing net nitrification rate at 0℃ (mgN kg-1 d-1); and βnit (no unit) is also the parameter indicating the dependency on the temperatures of net nitrification rates.
From βmin (or βnit), Q10min (or Q10nit, the rate by which it was increased for a 10℃ rise in temperature) was derived by the equations below (Sierra 1997):
In this data paper, Nmin0, Nnit0 and Q10s for both N mineralization and nitrification were included. However, if Nmin(t) ≤0, equation (3) could not be applied to the relationship between temperatures and net N mineralization rates, and Nmin0 and Q10min was not obtained. In the same way, Nnit0 and Q10nit were not obtained if Nnit(t) ≤0. In response to these cases, net N mineralization and nitrification rates at 20℃ (Nmin20 and Nnit20, respectively) were included and calculated as the average of the rates from equations (1) and (2).
6.C.9. Gross N transformation rates
Gross N mineralization and nitrification rates were measured for the surface soil layer (0–10 cm) by the 15N isotopic dilution method according to Kuroiwa et al. (2011). Fresh soils, collected as described in C-1, were contained in four 50-mL plastic centrifugation tubes (7 g each); two for 15NH4Cl, and two for Na15NO3 addition. After the pre-incubation for 24 h at 20℃, 1 mL of 1 mM 15N tracer solution was added by a syringe with needle to the soils (tracer addition corresponded to 2.5 ‒ 6.4 mgN kg-1 soil according to the water content of the samples) and they were incubated at 20℃ again. Soils were extracted 2 and 26 h after the incubation with 2 M KCl solution (fresh soil: 2M KCl = 1: 5, shaking for 1 h). The extracts were filtered by glass fiber filters (GF/F; Whatman Int. Ltd.) after centrifugation and frozen until concentration and isotopic ratio analyses. Concentrations of NH4-N for all sites and NO3-N for sites except the 10 selected sites (URN, ARR, APN, MRB, SGN, KSN, ASN, KGC, SBN, TKN) were measured by the colorimetric method (see C-6). Concentration of NO3-N for the selected 10 sites and the 15N isotopic ratio of NH4-N and NO3-N were measured by the “denitrifier method” using gas chromatography with a mass spectrometer (GCMS-QP2010 Plus or GCMS-QP2010 Ultra, Shimadzu) after conversion of NH4-N and NO3-N into N2O (Isobe et al. 2011b). The production and consumption rates of NH4-N and NO3-N were calculated according to Hart et al. (1994).
7. Data status
Latest update: October 2017
8. Accessibility
8.A. Usage rights:
Please inform the dataset owner about the use of the dataset when the publication based on, or derived from, this dataset is distributed.
8.B. Data updates:
The dataset will be updated or recalculated according to modifications of the measuring methods. Please check the latest version of the dataset.
8.C. Disclaimer:
In no event shall the authors and the dataset owners be liable for loss of profits, or for any indirect, incidental, or consequential damages arising from the use of the dataset.
8.D. Dataset owner:
See 3.A.
9. Data structure
9.A. Site metadata
9.A.1. Dataset file
Identity
: site_metadata.csv
Format and storage mode
: ASCII text, comma separated. No compression scheme was used.
Header information
: The first row of
the file contains the variable names below.
9.A.2. Variable information
| Variable name | Variable definition | Unit | Storage type | Precision |
|---|---|---|---|---|
| Map_No | Site location number of the map (Fig. 1 in 6. A.) | N/A | Integer | 1 |
| Site | Site name | N/A | Character | N/A |
| Abbr | Abbreviations of the sites in three characters | N/A | Character | N/A |
| N_degree | Degrees of North latitude | ° | Integer | 1 |
| N_minute | Minutes of North latitude | ′ | Integer | 1 |
| N_second | Seconds of North latitude | ″ | Integer | 1 |
| E_degree | Degrees of East longitude | ° | Integer | 1 |
| E_minute | Minutes of East longitude | ′ | Integer | 1 |
| E_second | Seconds of East longitude | ″ | Integer | 1 |
| Altitude | Altitude of the site | m | Integer | 10 |
| Slope_aspect | Slope aspect | N/A | Character | N/A |
| FSD | Classification of Japanese forest soils by Forest Soil Division (1976) | N/A | Character | N/A |
| WRB | Soil classification by IUSS Working Group WRB (2014) | N/A | Character | N/A |
| USDA | Soil classification by US Soil Taxonomy (2014) | N/A | Character | N/A |
| Forest_type | Forest type | N/A | Character | N/A |
| Dominant_tree_species | Dominant tree species in scientific name | N/A | Character | N/A |
| Understory | Understories in scientific name | N/A | Character | N/A |
| MAT | Mean annual temperature (average by approx. latest 10 years) * | ℃ | Real number | 0.1 |
| MAP | Mean annual precipitation (average by approx. latest 10 years) * | mm y-1 | Integer | 10 |
| Sampling_date_1 | Sampling date in yyyy/mm/dd for litter layers, soil bulk density, gravimetric water content, pH (H2O), total C and N concentrations, inorganic N concentrations, and water soluble substances measurements | N/A | Date | 1 |
| Sampling_date_2 | Sampling date in yyyy/mm/dd for net N mineralization rates measurements | N/A | Date | 1 |
| Sampling_date_3 | Sampling date in yyyy/mm/dd for gross N mineralization rates measurements | N/A | Date | 1 |
Missing value codes: ‘N.D.’ represents the missing or unspecified values.
*Air temperature and precipitation data were obtained from the climate monitoring station at each site or neighboring AMeDAS (Japan Meteorological Agency, 2014).
9.B. Litter layer
9.B.1. Dataset file
Identity
: litter_layer.csv
Format and storage mode
: ASCII text, comma separated. No compression scheme was used.
Header information
: The first row of the file contains the variable names below.
9.B.2. Variable information
| Variable name | Variable definition | Unit | Storage type | Precision |
|---|---|---|---|---|
| Site | Site name in abbreviation | N/A | Character | N/A |
| Layer | Fraction of litter layers: L_branch (branches in the fresh litter layer), L_leaf (leaves in the fresh litter layer) and FH (decomposed litter layer) | N/A | Character | N/A |
| Sampling_location | Number of the sampling locations | N/A | Integer | 1 |
| LL_S | Litter layer stock | Mg ha-1 | Real number | 0.01 |
| LL_C | Total C concentration of litter layer | % | Real number | 0.01 |
| LL_N | Total N concentration of litter layer | % | Real number | 0.01 |
| LL_CN | CN ratio of litter layer | N/A | Real number | 0.01 |
Missing value codes: ‘N.D.’ represents the missing or unspecified values.
9.C. Soil properties
9.C.1. Dataset file
Identity
: soil_properties.csv
Format and storage mode
: ASCII text, comma separated. No compression scheme was used.
Header information
: The first row of the file contains the variable names below.
9.C.2. Variable information
| Variable name | Variable definition | Unit | Storage type | Precision |
|---|---|---|---|---|
| Site | Site name in abbreviation | N/A | Character | N/A |
| Depth | Soil sampling layers | N/A | Character | N/A |
| Sampling_location | Number of the sampling locations | N/A | Integer | 1 |
| BD | Bulk density | g cm-3 | Real number | 0.01 |
| GWC | Gravimetric water content at sampling | g g-1 | Real number | 0.01 |
| pH(H2O) | pH (H2O) (fresh soil: deionized water = 20 g : 25 mL) | N/A | Real number | 0.01 |
| Total-C | Total C concentration | % | Real number | 0.01 |
| Total-N | N concentration | % | Real number | 0.01 |
| CN | CN ratio | N/A | Real number | 0.01 |
| KCl_NH4-N | Extractable NH4-N concentration in soil | mgN kg-1 | Real number | 0.001 |
| KCl_NO3-N | Extractable NO3-Nconcentration in soil | mgN kg-1 | Real number | 0.001 |
| WSOC | Water soluble organic carbon concentration in water extracts | mgC kg-1 | Real number | 0.001 |
| Na | Water soluble Na+ concentration | mmolc kg-1 | Real number | 0.001 |
| NH4 | Water soluble NH4+ concentration | mmolc kg-1 | Real number | 0.001 |
| K | Water soluble K+ concentration | mmolc kg-1 | Real number | 0.001 |
| Mg | Water soluble Mg2+ concentration | mmolc kg-1 | Real number | 0.001 |
| Ca | Water soluble Ca2+ concentration | mmolc kg-1 | Real number | 0.001 |
| Cl | Water soluble Cl- concentration | mmolc kg-1 | Real number | 0.001 |
| NO3 | Water soluble NO3- concentration | mmolc kg-1 | Real number | 0.001 |
| SO4 | Water soluble SO42- concentration | mmolc kg-1 | Real number | 0.001 |
| Al | Water soluble Al concentration | mg Al kg-1 | Real number | 0.001 |
| Fe | Water soluble Fe concentration | mg Fe kg-1 | Real number | 0.001 |
| Mn | Water soluble Mn concentration | mg Mn kg-1 | Real number | 0.001 |
| Cu | Water soluble Cu concentration | mg Cu kg-1 | Real number | 0.001 |
Missing value codes: ‘N.D.’ represents the missing or unspecified values.
9.D. Net N transformation rates
9.D.1. Dataset file
Identity
: net_n_transformation.csv
Format and storage mode
: ASCII text, comma separated. No compression scheme was used.
Header information
: The first row of the file contains the variable names below.
9.D.2. Variable information
| Variable name | Variable definition | Unit | Storage type | Precision |
|---|---|---|---|---|
| Site | Site name in abbreviation | N/A | Character | N/A |
| Depth | Soil sampling layers | N/A | Character | N/A |
| Nmin0 | Parameter Nmin0 in the equation (3) in 6. C. 8. | mgN kg-1 d-1 | Real number | 0.001 |
| Q10min | Q10 for net N mineralization rate | N/A | Real number | 0.001 |
| Nmin20 | Averaged net N mineralization rate at 20℃ | mgN kg-1 d-1 | Real number | 0.001 |
| Nnit0 | Parameter Nnit0 in the equation (4) in 6. C. 8. | mgN kg-1 d-1 | Real number | 0.001 |
| Q10nit | Q10 for net nitrification rate | N/A | Real number | 0.001 |
| Nnit20 | Averaged net nitrification rate at 20℃ | mgN kg-1 d-1 | Real number | 0.001 |
Missing value codes: ‘N.D.’ represents the missing or unspecified values.
9.E. Gross N transformation rates
9.E.1. Dataset file
Identity
: gross_n_transformation.csv
Format and storage mode
: ASCII text, comma separated. No compression scheme was used.
Header information
: The first row of the file contains the variable names below.
9.E.2. Variable information
| Variable name | Variable definition | Unit | Storage type | Precision |
|---|---|---|---|---|
| Site | Site name in abbreviation | N/A | Character | N/A |
| Depth | Soil sampling layers | N/A | Character | N/A |
| Sampling_location | Number of the sampling locations | N/A | Integer | 1 |
| GMIN | Gross N mineralization rate | mgN kg-1 d-1 | Real number | 0.001 |
| GNIT | Gross nitrification rate | mgN kg-1 d-1 | Real number | 0.001 |
| GNH4C | Gross NH4-N consumption rate | mgN kg-1 d-1 | Real number | 0.001 |
| GNO3C | Gross NO3-N consumption rate | mgN kg-1 d-1 | Real number | 0.001 |
Missing value codes: ‘N.D.’ represents the missing or unspecified values.
10. Acknowledgments
This study was conducted as part of the GRENE (Green Network of Excellence) environmental information project (PI: Motomi Itoh, University of Tokyo) from the Ministry of Education, Culture, Sports, Science and Technology, Japan. This work was also supported by the ReSIN-I, II, and III (Regional and comparative Soil Incubation study on Nitrogen dynamics in forest ecosystems) project funded by the Japan Society for the Promotion of Science, Japan (JP19380078, JP22248016 and JP25252026). We would like to thank the technical staff of the experimental forests and centers where the samples were collected for their support and cooperation.
11. Literature cited
Colman BP, Schimel JP (2013) Drivers of microbial respiration and net N mineralization at the continental scale. Soil Biol Biochem 60:65–76.
Fierer N, Colman BP, Schimel JP, Jackson RB (2006) Predicting the temperature dependence of microbial respiration in soil: A continental-scale analysis. Global Biogeochem Cycles 20:GB3026.
Forest soil division (1976) Classification of forest soil in Japan (1975). Bulletin of the Government Forest Experiment Station 280:1-28 (in Japanese with English summary).
Government forest experiment station (1951) Forest soils of Japan. Report 1. Tokyo, Japan.
Hart S, Stark J, Davidson E, Firestone M (1994) Nitrogen mineralization, immobilization, and nitrification. In Methods of Soil Analysis: Part 2—Microbiological and Biochemical Properties. SSSA Book Series 5.2, Soil Science Society of America, pp 985–1018.
Isobe K, Koba K, Otsuka S, Senoo K (2011a) Nitrification and nitrifying microbial communities in forest soils. J For Res 16:351–362.
Isobe K, Suwa Y, Ikutani J, Kuroiwa M, Makita T, Takebayashi Y, Yoh M, Otsuka S, Senoo K, Ohmori M, Koba K (2011b) Analytical techniques for quantifying 15N/14N of nitrate, nitrite, total dissolved nitrogen and ammonium in environmental samples using a gas chromatograph equipped with a quadrupole mass spectrometer. Microbes Environ 26:46–53.
IUSS working group WRB (2014) World Reference Base for Soil Resources 2014. International soil classification system for naming soils and creating legends for soil maps. World Soil Resources Report No. 106. FAO, Rome.
Japanese Society of Soil Science and Plant Nutrition (1997) V.1. pH (grass electrode method). In Methods of soil environmental analysis. Hakuyusha, Tokyo, pp 195-197 (in Japanese).
Japan Meteorological Agency (2014) Statistical Report for Weather in Japan. http://www.data.kishou.go.jp/menu/report.html
Kira T, Ono Y, Hosokawa T (1978) Biological production in a warm-temperate evergreen oak forest of Japan. JIBP Synthesis 18, University of Tokyo Press, Tokyo.
Kuroiwa M, Koba K, Isobe K, Tateno R, Nakanishi A, Inagaki Y, Toda H, Otsuka S, Senoo K, Suwa Y, Yoh M, Urakawa R, Shibata H (2011) Gross nitrification rates in four Japanese forest soils: heterotrophic versus autotrophic and the regulation factors for the nitrification. J For Res 16:363–373.
Shibata H, Urakawa R, Toda H, Inagaki Y, Tateno R, Koba K, Nakanishi A, Fukuzawa K, Yamasaki A (2011) Changes in nitrogen transformation in forest soil representing the climate gradient of the Japanese archipelago. J For Res 16:374–385.
Sierra J (1997) Temperature and soil moisture dependence of N mineralization in intact soil cores. Soil Biol Biochem 29:1557–1563.
Soil Survey Staff (2014) Keys to Soil Taxonomy, 12th ed. USDA-Natural Resources Conservation Service, Washington, DC.
The National Ecological Observatory Network, Inc. 2013. (2013) The NEON Soil Archive. http://www.neoninc.org/science/soil-archive.
Urakawa R, Shibata H, Kuroiwa M, Inagaki Y, Tateno R, Hishi T, Fukuzawa K, Hirai K, Toda H, Oyanagi N, Nakata M, Nakanishi A, Fukushima K, Enoki T, Suwa Y (2014) Effects of freeze–thaw cycles resulting from winter climate change on soil nitrogen cycling in ten temperate forest ecosystems throughout the Japanese archipelago. Soil Biol Biochem 74:82–94.
Wright RF, van Breemen N (1995) The NITREX project: an introduction. For Ecol Manage 71:1–5.
