Tomakomai site after 2004

Overview
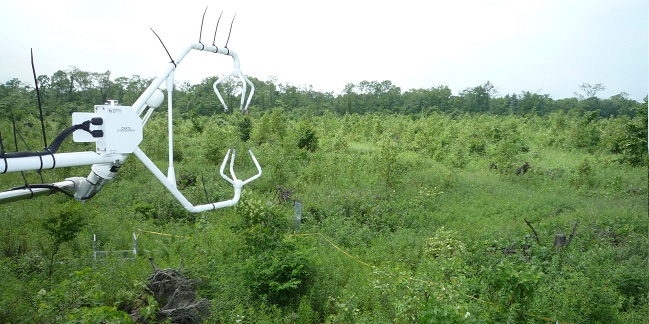
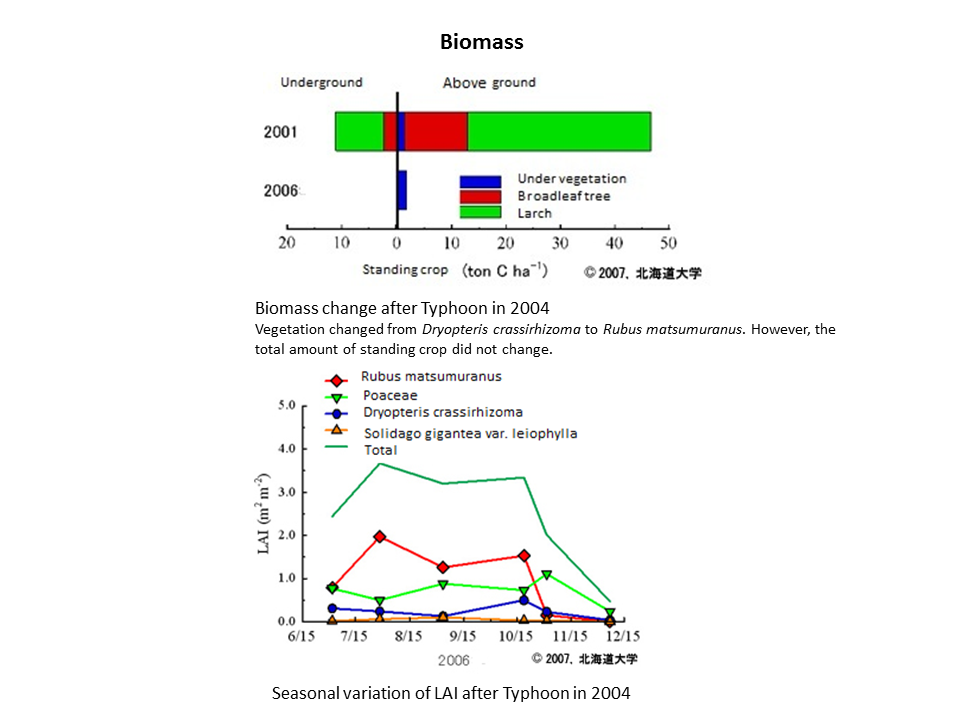
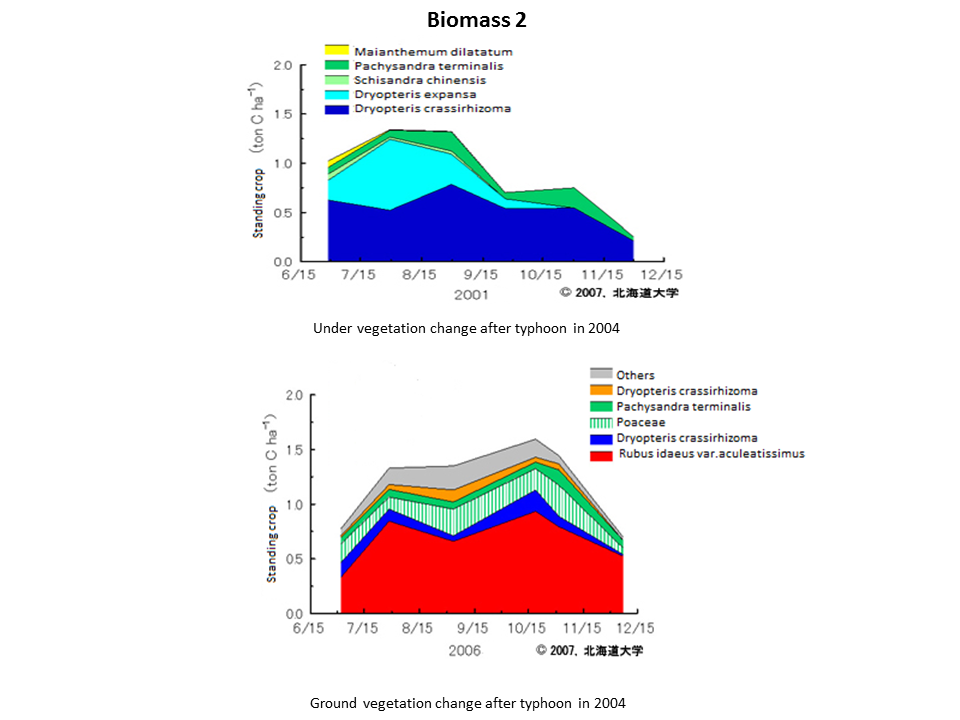
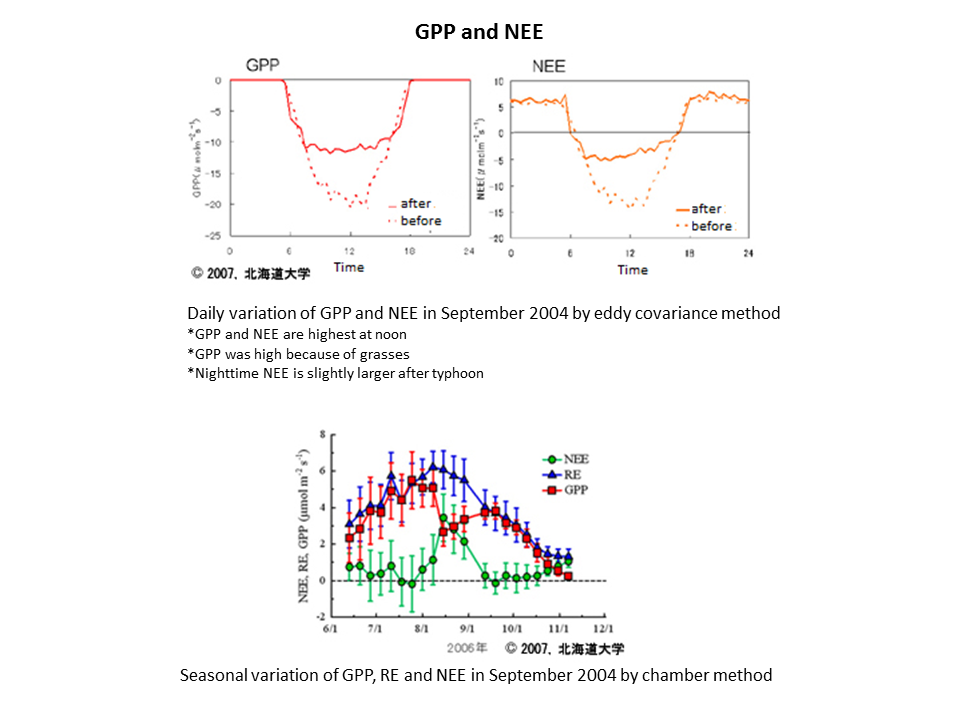
Approximately 37 thousand ha of forest were damaged by strong winds accompanying a typhoon in September 2004; 90 % of forest at the Tomakomai site was also affected. Observations were stopped under such conditions. However, we started vegetation recovery monitoring focusing on CO2, H2O and heat flux exchanges in the growing season, as the disturbance would have an effect on carbon exchanges and ecosystem functions. The monitoring had been conducted in cooperation with the Experimental Plantation and Faculty of Agriculture of Hokkaido University. The monitoring was conducted only in growing season at the beginning, but we build tower in 2012 and started full year observation from 2015.
Observation site
| Location |
Forest No.1196-1198, Tomakomai National Forest, Tomakomai, Hokkaido (Within the jurisdiction of Tomakomai Office, Iburi-higashi Forest Management Office) Latitude and Longitude: 42º 44' 13.1" N,141º 31' 7.1" E Elevation: 115-140 m |
|---|---|
| Land |
Gradient: 1-2 degree Soil type: Volcanogenous regosol |
| Vegetation | Dominant Species: Rubus matsumuranus, Solidago gigantea var. leiophylla, Betula platyphylla |
| Mean annual air temperature | 6.5℃ (2001-2003) |
| Annual precipitation | 1055 mm (2001-2003 |
| Annual global solar radiation | 4199 MJm-2(2001-2003) |
Observation Facilities
| Observation tower | 12 m heigh. CO2/H2O flux and micrometeorology monitoring system |
|---|---|
| Automated chambers | CO2 flux observation (vegetation, soil. stump and root) |
Observation System
| System | Item | Number | Installed Place (m) |
|---|---|---|---|
| Eddy covariance method | Three-dimensional sonic anemometer-thermometer | 1 | 6 m |
| Open-path systems (CO2 and H2O flux) | 1 | 6 m | |
| Soil respiration | Automated chambers | 18 | forest floor |
| Meteorology | Global solar radiation (incoming) |
1 | 11.2 m |
| Global solar radiation (outgoing) |
1 | 11.2 m | |
| PPFD (incoming) | 1 | 11.2 m | |
| PPFD (outgoing) | 1 | 11.2 m | |
| Long wave radiation (incoming) | 1 | 11.2 m | |
| Long wave radiation (outgoing) | 1 | 11.2 m | |
| Wind direction and speed | 1 | 12 m | |
| Air temperature and humidity | 2 | 1.5 m, 6.2 m | |
| Precipitation | 1 | 1.5 m | |
| Atmospheric pressure | 1 | 1.4 m | |
| Soil temperature | 20 | 1, 3, 6, 15, 50 cm * 4 point | |
| Soil water content | 20 | 1~5 cm | |
| Soil heat flux | 4 | 6cm | |
| Vegetation(above ground and underground biomass, Leaf Area Index (LAI)) | floor |
Results
- Available Observation Data (Go to Database Portal)
- Some results (Click on the image to see details)


