Calculation
This tool calculates two types of footprints at any date and location. One is the contribution of near surface particles arriving at a given point, and the other is the distribution of particles emitted from a given point.
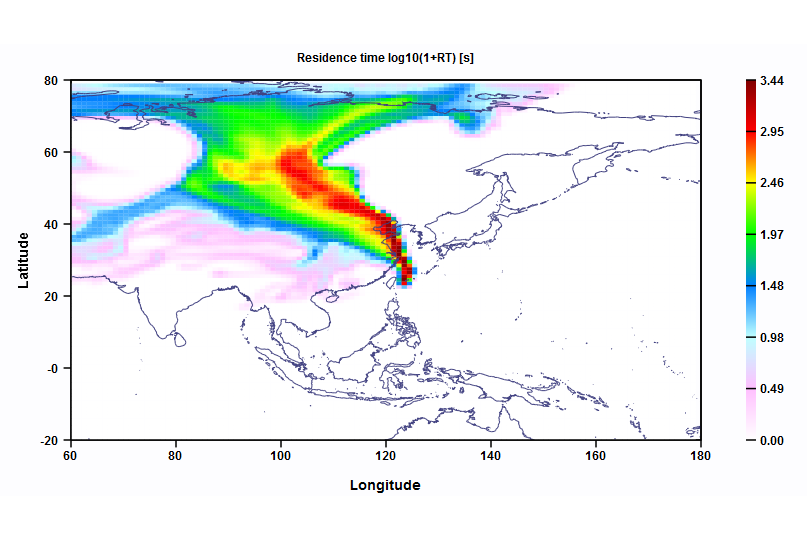
Figure 1 shows the results of the contribution of the near surface particles at Hateruma station. The color contour indicates the mean residence time of Lagrangian particles in 1°×1° grid cells in the upwind regions to the observation point.
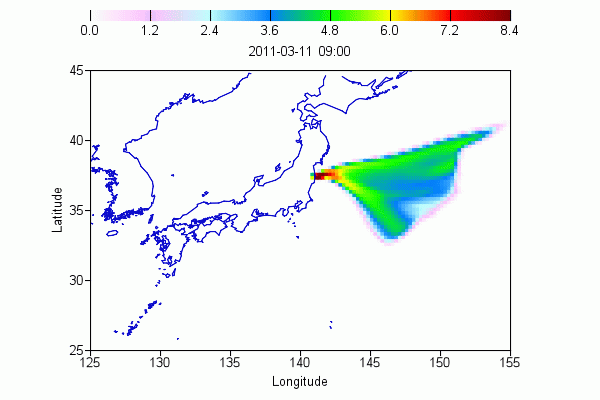
Movie 1 shows every 3-hours distributions of particles emitted from the coast of Fukushima Prefecture and dispersed for 10 days.
This tool uses FLEXCPP (Zeng, et al., 2013 ) which is a Lagrangian particle dispersion program developed by the Center for Global Environmental Research (CGER), Earth System Division (ESD), National Institute for Environmental Studies (NIES) based on the open source FLEXPART (FLEXible PARTicle dispersion model).