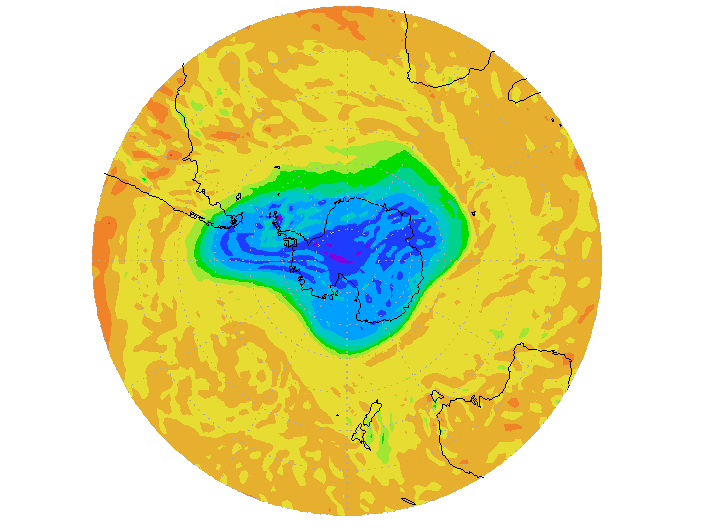
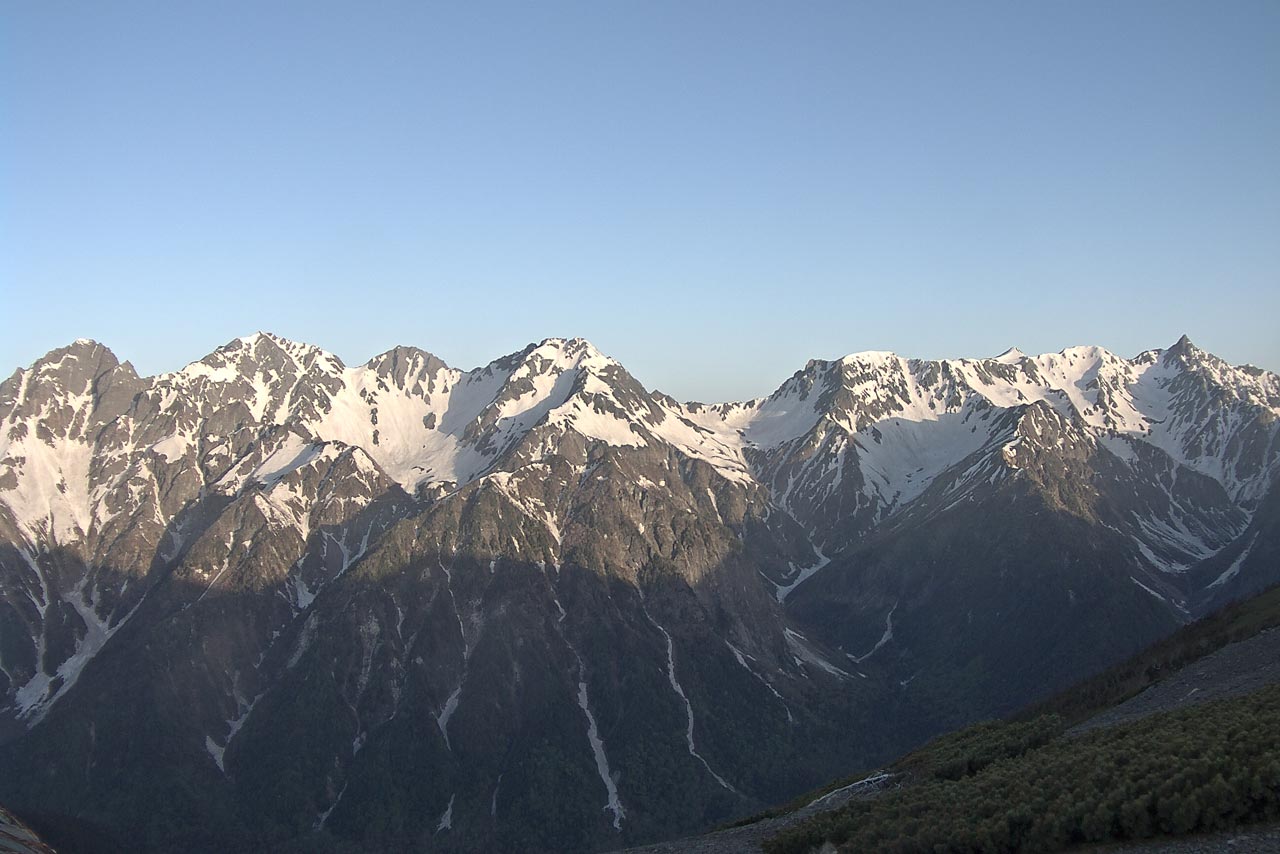
Greenhouse Gases Trend Update

The Global Greenhouse Gases Database (G3DB) of CGER comprises two parts: The WDCGG Online Application for data query and visualization of WDCGG database and the Greenhouse Gases Trend Update (GGTU) for providing quick access to greenhouse gases concentrations from monitoring stations of CGER. Now hourly CO2 concentration data from Hateruma and Ochiishi stations are being updated to GGTU database in real time. The daily means are then calculated from hourly data and used to analyze long-term trend and to estimate annual increase rate. From this site you can see the most up-to-date annual CO2 increase rate; CO2 concentrations of daily mean, weekly mean, monthly mean, and annual mean; and hourly variations of CO2 concentrations in the past week, month, and year.

An online application for trend analysis is provided to let users analyze their data. Daily data of many species of greenhouse gases may be extracted from WDCGG database for such analysis.

This site also provide online calculation of 5-day backward air trajectories in 1960 to 2007 for world CO2 monitoring stations. As shown in the CO2-Trajectory animations, observed variations of CO2 concentration are strongly related to air flow when the change of source or sink strength is large from region to region around a station.


For further information, please send an e-mail to: www-cger@nies.go.jp
National Institute for Environmental Studies
16-2 Onogawa, Tsukuba-City, Ibaraki, 305-8506 Japan.
Copyright(C) National Institute for Environmental Studies. All Rights Reserved.