Metadata
Title
Image dataset of ophiuroid and other deep sea benthic organisms in 2015 extracted from the survey off Sanriku, Japan, by the research following the Great East Japan Earthquake 2011
Authors
Takehisa Yamakita1,4*, Hiroyuki Yokooka2, Yoshihiro Fujiwara1, Masaru Kawato1, Shinji Tsuchida1, Shojiro Ishibashi1, Tadayuki Kurokawa3, Katsunori Fujikura1
- Project Team for Analyses of Changes in East Japan Marine Ecosystems, Japan Agency for Marine-Earth Science and Technology (JAMSTEC), 2-15, Natsushima-cho, Yokosuka-city, Kanagawa 237-0061, Japan
- IDEA Consultants, Inc., Institute of Environmental Ecology, 1334-5 Riemon, Yaizu city, Shizuoka 421-0212, Japan
- IDEA Consultants, Inc., Institute of Environmental Informatics, 2-2-2 Hayabuchi, Tsuzuki-ku, Yokohama city, Kanagawa 224-0025
- Environmental Dynamics and Management Group, Graduate School of Biosphere Science, Hiroshima University, 1-3-2 Kagamiyama, Higashi-Hiroshima City, Hiroshima, 739-8511, Japan
*Corresponding author: Dr., Takehisa Yamakita
Project Team for Analyses of Changes in East Japan Marine Ecosystems,
Japan Agency for Marine-Earth Science and Technology (JAMSTEC),
2-15, Natsushima-cho, Yokosuka-city, Kanagawa, 237-0061,Japan
Tel.: +81(46)-867-972
E-mail: yamakitat@jamstec.go.jp
Abstract
This is the first large image dataset and occurrence records of marine organisms in the Northwest Pacific off Tohoku, Japan. This area suffered by Great East Japan Earthquake 2011 and continental shelf and slope off of this area considered one of the most productive areas both for fishery and primary production in the world because of the complex mixture of the Kuroshio Current, Oyashio Current, and Tsugaru Warm Current. We compiled 3415 images of animals, stones, and sediments. Most of the images are of dominant species of Ophiuroidea (brittle stars), with 789 and 1421 images captured in two areas of different depth. These images are cropped from downward camera images collected during two dives in 2015 using remotely operated vehicles in a deeper area (670-800 m deep) off Kamaishi (cruise id KY15-08; dive no. HPD1812) and a shallower area (280 m deep) off Minami Sanriku town (cruise id NT15-E04; dive no. CRB17). The attribute of each image is listed in the subsequent comma delimited (csv) text file and the observed occurrence of each organisms was also converted into the text format used in Japan Ocean Biogeographic Information System Center (J-OBIS), which is comparable with Darwin Core 2.0. Basically, we recorded the higher taxonomic levels (e.g., order and class) that could be specified with certainty and added a list of potential species as an appendix. For better understanding the broad-scale impact of the earthquake along the continental shelf and slope, it is necessary to extract occurrence data of organisms from biological surveys. Gathering image or video data is appropriate for this purpose because most underwater surveys simultaneously record images and/or videos. This dataset will add the information of the status after 4 years of the disaster. These image data are also considered as training image data set for automatic extraction of organisms.
Key words
- brittle stars
- image database
- Tohoku, Japan
- Great East Japan Earthquake
- Computer Vision (CV)
- remotely operated vehicle (ROV)
- marine and aquatic image
Introduction
The Great East Japan Earthquake occurred on 11 March 2011. The quake caused long shaking and ground subsidence in a wide area of eastern Japan, followed by huge tsunamis that destroyed coastal areas on the Pacific coast of the Tohoku region of northeastern Japan. Changes in natural environments in shallow coastal areas have been reported (Kanaya et al. 2012; Seike et al. 2013; Yamakita et al. 2015, 2017, 2018) as well as methane blow-out in a deep sea area (>2000 m) close to the epicenter (Kawagucci et al. 2012; Kitahashi et al. 2014). Although there are trails of the turbidity current in some places (Arai et al. 2013) and an accumulation of marine debris in a deep sea valley (Yamakita et al. 2016; Shibata et al. 2017), little is known about their effect on ecosystems in the majority of the deep sea area along the continental shelf and slope.
For better understanding the broad-scale impact of the earthquake along the continental shelf and slope, it is necessary to extract occurrence data of organisms from biological surveys. Gathering image or video data is appropriate for this purpose because most underwater surveys simultaneously record images and/or videos. Moreover, several archive systems of underwater survey video and images exist, such as the JAMSTEC E-library of Deep-sea Images (J-EDI) or Research Information and data Access Site (RIAS) of Tohoku Ecosystem-Associated Marine Sciences (TEAMS). Using these data would enable us to increase the number of survey locations and broaden the geographical range.
Counting organisms from image data is usually performed manually, and it is a time-consuming process. However, with the recent increase in computer speed and the rapid development of machine learning methods, automatic recognition and extraction of various objects in an image or video is becoming possible. In addition to the increased machine power, emerging learning methods are expected to perform better by using a multilayered neural network such as Convolutional Neural Network (CNN).
Proper data preparation is indispensable for such automatic recognition. In particular, the application of deep learning such as CNN requires more massive datasets than traditional machine learning (Krizhevsky et al. 2012). For that reason, various image datasets have been prepared in recent years. Image Net (Russakovsky et al. 2015), Caltech-101/256 (Fei-Fei et al. 2004; Griffin et al. 2007), CIFAR-10/100 (Krizhevsky 2009), and MIR-FLICKR-1M (Huiskes and Lew 2008) are popular examples of natural image datasets. In the case of Image Net, it has 14.19 million images registered in May 2017, and labels corresponding to 21,841 nouns in lexical database of English (WordNet ontology; Fellbaum 1998) are given.
Of course, existing pertained learned models (Krizhevsky et al. 2012; Szegedy et al. 2014; He et al. 2016) cannot classify more than the labels applied in the processed data from the image datasets. In the case of ImageNet, 856 bird, 566 fish, 1666 plant, and 993 tree subcategories have been prepared, with an average of more than 400 images in each subcategory. However, those categories do not correspond to species, phylogenic or functional groups. In particular, minor organisms have few images and may not have a label category.
To extract a detailed category such as a phylogenic or functional group, the user needs to add a new learning layer at the end of the prepared learning model, a process known as fine-tuning. It is also possible to produce an original learning model using all the available images while including additional images. Because such learning takes time, this will be appropriate for identifying a few categories or for traditional machine learning. The image data provided here will assist in this part of the learning.
In this paper, we present the first large image dataset of marine organisms in the Northwest Pacific off Tohoku, Japan. In particular, we extracted dominant species of Ophiuroidea (brittle stars). Although other organisms or materials (such as stones) were also extracted, ophiuroids are the indicator organisms in this area, particularly of changes in the bottom environment because these organisms are sensitive to environmental changes (Parker 1956; Rodrigues et al. 2001) and difficult to keep in an aquarium in the case of the species dominated in this region (Yamakita 2018 and based on personal observation and interview). Changes in dominant species also indicate at least some modification of the bottom environment. These species are also important indicators as prey of fishes. In fact Ophiuroids are frequently found in the gut contents of Sebastolobus macrochir (Günther, 1877), (thornyhead, kichiji) and Clidoderma asperrimum (Temminck & Schlegel, 1846), (roughscale sole) in the area (Fujita 1996; Goto 2004; Hattori et al. 2009). Some flat fish species specialize in feeding on ophiuroids, which serve as important food sources. Therefore, the extraction of brittle stars and estimation of their density are useful not only for assessing the changes that occurred after the earthquake and tsunami but also for evaluating the sustainability of the fisheries in the region.
Metadata
1. TITLE
Image dataset of ophiuroid and other deep sea benthic organisms in 2015 extracted from the survey off Sanriku, Japan, by the research following the Great East Japan Earthquake of 2011
2. IDENTIFIER
ERDP-2018-02
3. CONTRIBUTOR
A. Dataset Owner
Takehisa Yamakita
Environmental Impact Assessment Research Group,
Research and Development Center for Submarine Resources,
Japan Agency for Marine-Earth Science and Technology (JAMSTEC),
2-15, Natsushima-cho, Yokosuka-city, Kanagawa 237-0061, Japan
Tel.: +81(46)-867-9727
E-mail: yamakitat@jamstec.go.jp
B. Contact Person
Takehisa Yamakita
Environmental Impact Assessment Research Group,
Research and Development Center for Submarine Resources,
Japan Agency for Marine-Earth Science and Technology (JAMSTEC),
2-15, Natsushima-cho, Yokosuka-city, Kanagawa 237-0061, Japan
Tel.: +81(46)-867-9727
E-mail: yamakitat@jamstec.go.jp
4. PROJECTS
A. Titles
Tohoku Ecosystem-Associated Marine Sciences (TEAMS)
B. Personal
Takehisa Yamakita
Environmental Impact Assessment Research Group,
Research and Development Center for Submarine Resources,
Japan Agency for Marine-Earth Science and Technology (JAMSTEC),
2-15, Natsushima-cho, Yokosuka-city, Kanagawa, 237-0061, Japan
Tel.: +81(46)-867-9727
E-mail: yamakitat@jamstec.go.jp
C. Funding
The Ministry of Education, Culture, Sports, Science and Technology (MEXT), Japan
5. GEOGRAPHIC COVERAGE
A. Geographic Description
Offshore of Kamaishi-city, Iwate, and Minami Sanriku, Miyagi, Japan
B. Geographic Position
From E 142.33018, N 39.30331833 to E 142.290305, N 39.311845 for KY15-08 HPD1812 and from E 141.9458783, N 38.55743 to E 141.94608, N 38.56725 for NT15-E04 CRB17 (WGS 84)
6. TEMPORAL COVERAGE
A. KY15-08 HPD1812
15 May 2015
B. NT15-E04 CRB17
12 Nov. 2015
7. METHODS
A. Study Sites
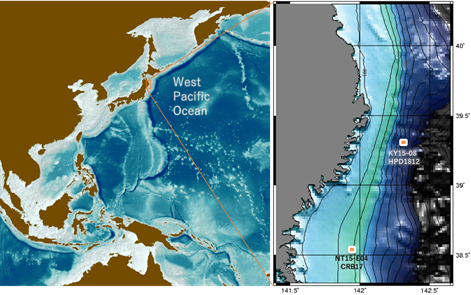
Fig. 1. Study area in the Northwest Pacific Ocean off Sanriku (Iwate and Miyagi Prefectures) of Japan.
Continental shelf and slope off of the Sanriku area located in the temperate Northwest Pacific Ocean. This is considered one of the most productive areas both for fishery and primary production in the world because of the complex mixture of the Kuroshio Current, Oyashio Current, and Tsugaru Warm Current (The Oceanographic Society of Japan 1985). Although the coastal area was heavily damaged by the tsunami and ground subsidence caused by the earthquake, effects in the deep sea area are not well understood.
For this survey, we focused on two depths: a shallower area (280 m deep) off Minami Sanriku town surveyed on 12 Nov. 2015 (cruise id NT15-E04; dive no. CRB17) and a deeper area (670 to 800 m deep) off Kamaishi surveyed on 5 May 2015 (cruise id KY15-08; dive no. HPD1812). We observed the deep sea bottom using a remotely operated vehicle (ROV). It conducted survey at bottom from 8:48 to 15:30 for CRB17 and worked at bottom from 8:58 to 15:43 in HPD1812. The distance of the dives are 3.6 km and 1.1 km.
B. Datasets Used and Survey Method
We used two different ROVs and two similar pieces of downward camera equipment. One is the Hyper Dolphin (HPD), a multipurpose ROV capable of performing surveys up to 3000 m deep. We installed a portable stereo camera system on the retroactive sample basket. The other is the CRAMBON (CRB), a brand new ROV intended to be used for after-quake surveys, mainly to depths up to 1000 m. The CRAMBON is designed to be portable and fitted to any vessel. It also has basic sampling functions using a suction sampler and robotic arm and searching using acoustic sonar. We installed the optional downward camera system designed for this ROV. Both camera systems have similar specs, which are summarized in Table 1.
| Name | Height of camera focus from DVL* | Focal length | Aperture | Resolution | Field of View | Sensor size (inchi) |
|---|---|---|---|---|---|---|
| Hyper Drophin (HPD) | 61.5 mm | 8mm | F8 | 5M pixcel 2448 x 2048 | 43°horizontal 28°vertical |
2/3 |
| Crambon (CRB) | 10 mm | 8mm | F8 | 5M pixcel 2448 x 2048 | 43°horizontal 28°vertical |
2/3 |
*DVL: Doppler velocity logs
C. Extraction of Organisms from Images
We extracted images of organisms by digitally clipping images manually using rectangles. Basically, we extracted all the different organisms and objects that may be detectable. After the extraction of several organisms, we conducted automatic direction to detect all the organisms. We used traincascade function of Open CV (an open source computer vison library) which enable cascade classifier. Harr like features have been used to create features to be classified and AdaBoost learner was used to build classifier model (Viola and Jones 2004). This flame work is popularly used in face detection or detection of the pedestrians. Using the machine learning model, we extracted more images of organisms and classification errors, particularly non-organism objects (such as stones) and the crossed arms of Brittle stars. Then increased more images likely to misclassify as organism by computer vison.
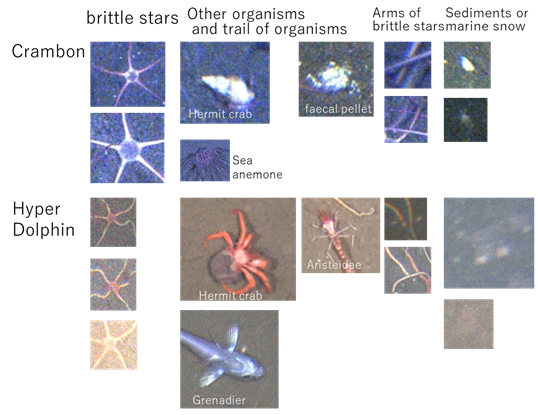
Fig.2. Examples of extracted organisms and objects.
8.TAXONOMY AND SYSTEMATICS
All organisms were identified by the authors or by research collaborators who are experts for each phylogeny. Basically, we recorded the higher taxonomic levels (e.g., order and class) that could be specified with certainty and added a list of potential species as an appendix. In most cases we could not obtain sufficient information to identify the exact species from an image because the key to species-level identification is a small or hidden part of the body. However, a few species could be assumed based on their distribution from field sampling. Scientific names followed the Catalogue of Life (http://www.catalogueoflife.org/).
9. DATA STRUCTURE
A. File Format
The data files are saved in png image format and compressed into the commonly used zip format. The categories of the images are written in each sub-folder under the folder of each dive survey in the zip file. The attribute of each image is listed in the subsequent comma delimited (csv) text file. The observed occurrence of each organisms was also converted into the text format used in J-OBIS (Yamamoto et al. 2012), which is comparable with Darwin Core 2.0.
B. Data Storage
The published data were provided by the Research Information and data Access Site of TEAMS, which is the database of the JAMSTEC Tohoku Ecosystem-Associated Marine Sciences (TEAMS). (http://www.i-teams.jp/catalog/rias/metadataDisp/0182_D01?lang=en)
C. List of the Files
| Datafile name | Description |
|---|---|
| 2015teams_tohoku_ext_img_yamakita_rev1.zip | Image dataset of extracted organisms and objects. |
| 2015teams_tohoku_ext_img_yamakita_metadata_diradsb_rev1.csv | Metadata of each image. |
| 2015teams_tohoku_ext_img_yamakita_somespp_DwC2_rev2.csv | Darwin Core formatted records that can identified at a higher taxonomic level. |
D. Details of the Data Table
Data table of each file is as follows.
The image data compressed in zip has the following
variables in file names delimited by “-” and “_” (e.g.,
“10-20-14.156_L_2124-1916-74-81_.png” and
“151112_0851_0088_1514-1273-106-114_.png_cutimg_buff0.2.png“):
| Variables in file name | Description |
|---|---|
| Original image name | Original image filename automatically recorded by the camera system. In the case of the stereo camera in HPD, the image name consists of four parts separated by “-” and “_”. Month, date, elapsed time, and camera position (right side or left side of the stereo camera system) successively, (e.g. 10-20-14.156_L). For the camera in CRB, the image name consists of three parts separated by “_”. YYMMDD (Year, month, date), HHMM (hour, minutes), and counting number (e.g., 151112_0851_0088). |
| The starting position of rectangle | Consist of the two numbers X and Y successively (e.g., 2124-1916 for the first example and 1514-1273 for the second example); the number of pixels in each of the X and Y directions from the origin to the starting position of the rectangle that includes an object. Origin of X and Y is the upper left corner of the original image. |
| The size of rectangle | Consist of the two numbers X and Y successively (e.g., 74-81 for the first sample and 106-114 for the second sample); the number of pixels in each of the X and Y directions is the size of the rectangle, which is measured from the starting position to the end position of the rectangle. |
| Other pretreatment (optional) | In those cases when we resized or cut out part of the image depending on their specifications, in additional comments are left here. (e.g., cutimg_buff0.2 in the case of trimmed) |
The data file named “2015teams_tohoku_ext_img_yamakita_metadata_diradsb_rev1.csv” has the following parameter names:
| Variables name | Description |
|---|---|
| dateanddivenumber | date and dive number, which is written in the first level of the folder |
| category | category of each image file (arm_of_brittle_star,bivalve , brittle_star_o_normani, brittle_star_o_sarii, fish, gastropod, hermit_crab, marine_snow_sediment, others, pellet, seaanemone, shrimp, starfish) |
| filename | all filenames of the images |
| filenamewithpath | the filename with path from the maternal folder |
The data file named “2015teams_tohoku_ext_img_yamakita_somespp_DwC2_rev2.csv” has the following parameter names. Detail of the definition and descriptions are listed on the OBIS web site (http://www.iobis.org/manual/darwincore/):
| Variable name | Description |
|---|---|
| eventID | An identifier for the set of information associated with an Event (something that occurs at a place and time). |
| parentEventID | An event identifier for the super event which is composed of one or more sub-sampling events |
| eventDate | The date-time or interval during which an Event occurred |
| eventRemarks | Comments or notes about the Event |
| habitat | A category or description of the habitat in which the Event occurred |
| identifiedBy | A list (concatenated and separated) of names of people, groups, or organizations who assigned the Taxon to the subject. |
| identificationQualifier | A brief phrase or a standard term ("cf.", "aff.") to express the determiner's doubts about the Identification |
| waterBody | The name of the water body in which the Location occurs |
| country | The name of the country or major administrative unit in which the Location occurs |
| locality | The specific description or name of the place. |
| minimumDepthInMeters | The lesser depth of a range of depth below the local surface, in meters |
| maximumDepthInMeters | The greater depth of a range of depth below the local surface, in meters |
| decimalLatitude | The geographic latitude (in decimal degrees, using the spatial reference system given in geodeticDatum) of the geographic center of a Location |
| decimalLongitude | The geographic longitude (in decimal degrees, using the spatial reference system given in geodeticDatum) of the geographic center of a Location |
| coordinateUncertaintyInMeters | The horizontal distance (in meters) from the given decimalLatitude and decimalLongitude describing the smallest circle containing the whole of the Location |
| materialSampleID | Sample label number of original data (name of the image in this case) |
| individualCount | The number of individuals represented present at the time of the Occurrence |
| occurrenceStatus | A statement about the presence or absence of a Taxon at a Location |
| modified | The most recent date-time on which the resource was changed |
| rightsHolder | A person or organization owning or managing rights over the resource |
| accessRights | Information about who can access the resource or an indication of its security status. Access Rights may include information regarding access or restrictions based on privacy, security, or other policies |
| bibliographicCitation | A bibliographic reference for the resource as a statement indicating how this record should be cited (attributed) when used |
| institutionCode | The name (or acronym) in use by the institution having custody of the object(s) or information referred to in the record |
| basisOfRecord | The specific nature of the data record |
| scientificNameID | An identifier for the nomenclatural (not taxonomic) details of a scientific name |
| scientificName | The full scientific name (with authorship and date information if known. => add to scientificNameAuthorship) |
| scientificNameAuthorship | The authorship information for the scientificName formatted according to the conventions of the applicable nomenclaturalCode |
| taxonRank | The taxonomic rank of the most specific name in the scientificName |
| taxonRemarks | Comments or notes about the taxon or name |
| Local_name(Japanese) | Taxon or species name in local name (Japanese) |
Note: NA, not available.
10. ACCESSIBILITY
A. License
This dataset is provided under a Creative Commons Attribution 4.0 International license (CC-BY 4.0) (https://creativecommons.org/licenses/by/4.0/).
11. ACKNOWLEDGMENTS
We are grateful to all members of each cruise for helping with our survey. We thank the editor and two anonymous reviewers for providing valuable comments on the manuscript. This work was financially supported by the research program on Tohoku Ecosystem-Associated Marine Sciences (TEAMS) subsidized by the Ministry of Education, Culture, Sports, Science and Technology (MEXT).
12. LITERATURE CITED
Arai K, Naruse H, Miura R, et al (2013) Tsunami-generated turbidity current of the 2011 Tohoku-Oki earthquake. Geology 41:1195-1198. doi: 10.1130/G34777.1
Fei-Fei L, Fergus R, Perona P (2004) Learning generative visual models from few training examples: an incremental Bayesian approach tested on 101 object categories. In:2004 IEEE Conference on Computer Vision and Pattern Recognition (CVPR) 178. doi: 10.1109/CVPR.2004.109
Fellbaum C (1998) WordNet: An Electronic Lexical Database. MIT Press. Cambridge, MA. pp. 449
Fujita T (1996) Bathymetric distribution of ophiuroids (Echinodermata) off Sendai Bay, northern Japan, with notes on the diet of the roughscale sole Clidoderma asperrimum (Pisces, Pleuronectidae). Mem Natl Sci Museum 29:209-222.
Goto T (2004) Age, growth, maturation and food of kichiji rock fish, Sebastolobus macrochir, distributing off Iwate prefecture, Pacific coast of northern Honshu, Japan. Bulletin of Iwate Prefectural Fisheries Technology Center 4:39-47.
Griffin G, Holub A, Perona P (2007) Caltech-256 object category dataset. Caltech mimeo 11:20.
Hattori T, Okuda T, Narimatsu Y, et al (2009) Spatiotemporal variations in nutritional status and feeding habits of immature female bighand thornyhead Sebastolobus macrochir off the Pacific coast of northern Honshu, Japan. Fish Sci 75:611-618.
He K, Zhang X, Ren S, Sun J (2016) Deep Residual Learning for Image Recognition. In: 2016 IEEE Conference on Computer Vision and Pattern Recognition (CVPR). pp 770-778.
Huiskes MJ, Lew MS (2008) The MIR flickr retrieval evaluation. In: Proceeding of the 1st ACM International Conference on Multimedia Information Retrieval (MIR 2008). p 39.
Kanaya G, Suzuki T, Maki H, et al (2012) Effects of the 2011 tsunami on the topography, vegetation, and macrobenthic fauna in Gamo Lagoon, Japan. Jap J Benthol 67: 20-32. (in Japanese with English abstract). doi: 10.5179/benthos.67.20
Kawagucci S, Yoshida YT, Noguchi T, et al (2012) Disturbance of deep-sea environments induced by the M9.0 Tohoku Earthquake. Scientific Reports 2: 270. doi:10.1038/srep00270.
Kitahashi T, Jenkins RG, Nomaki H, et al (2014) Effect of the 2011 Tohoku Earthquake on deep-sea meiofaunal assemblages inhabiting the landward slope of the Japan Trench. Mar Geol 358:128-137.
Krizhevsky A (2009) Learning multiple layers of features from tiny images. Sci Dep Univ Toronto, Tech. 1-60. doi: 10.1.1.222.9220
Krizhevsky A, Sutskever I, Hinton GE (2012) ImageNet Classification with deep convolutional neural networks. In: Proceedings of the 25th International Conference on Neural Information Processing Systems. pp 1097-1105.
Parker RH, (1956) Macro-invertebrate assemblages as indicators of sedimentary environments in east Mississippi Delta region. AAPG (American Association of Petroleum Geologists) Bulletin 40: 295–376.
Rodrigues N, Sharma R, Nath BN (2001) Impact of benthic disturbance on megafauna in Central Indian Basin. Deep Sea Res Part II Top Stud Oceanogr 48:3411–3426.
Russakovsky O, Deng J, Su H, et al (2015) ImageNet Large Scale Visual Recognition Challenge. Int J Comput Vis 115:211-252. doi: 10.1007/s11263-015-0816-y
Seike K, Shirai K, Kogure Y (2013) Disturbance of shallow marine soft-bottom environments and megabenthos assemblages by a huge tsunami induced by the 2011 M9.0 Tohoku-Oki. PLoS One 8:e65417.
Shibata Y, Sakuma T, Wada T, et al (2017) Effect of decreased fishing effort off Fukushima on abundance of Japanese flounder (Paralichthys olivaceus) using an age structured population model incorporating seasonal coastal offshore migrations. Fish Oceanogr 26:193-207.
Szegedy C, Liu W, Jia Y, et al (2015) Going deeper with convolutions. In: 2015 IEEE Conference on Computer Vision and Pattern Recognition (CVPR). pp 1–9. doi: 10.1109/CVPR.2015.7298594
The Oceanographic Society of Japan (1985) Sanriku coastal waters. In: Coastal Oceanography of Japanese Islands. Tokai University Press, Hiratsuka, pp 209– 283.
Viola P, Jones M J (2004) Robust real-time face detection. International journal of computer vision 57:137-154.
Yamakita T (2018) Change of the ocean after the Great East Japan Earthquake -Utilization of Geographic Information System and GIScience. E-Research in Species Biology 2: in press
Yamakita T, Fujiwara Y, Tsuchida S, et al (2016) Use of bottom image mapping by a new underwater camera system and application of 3D mosaicking to observe spatial distribution of benthic organisms off Sanriku. In: Kogure K, Hirose M, Kitazato H, Kijima A (eds) Marine Ecosystems after Great East Japan Earthquake in 2011: Our Knowledge Acquired by TEAMS. Tokai University Press, pp 141-142.
Yamakita T, Matsuoka Y, Iwasaki S (2017) Impact of the 2011 Tohoku Earthquake on the use of tidal flats: a case study in Inner Tokyo Bay. Journal of Environmental Information Science. 2017(1):25-36.
Yamakita T, Yamamoto H, Yokoyama Y, et al (2015) Distribution of the marine debris on seafloor from the primary report of five cruises after the Great East Japan Earthquake 2011. In: Marine Productivity: Perturbations and Resilience of Socio-ecosystems. pp 101-109.
Yamamoto H, Tanaka K, Fujikura K, Maruyama T (2012) BISMaL: Biological Information System for Marine Life and role for biodiversity research. In: The Biodiversity Observation Network in the Asia-Pacific Region. Springer, pp 247-256.
