Metadata
Title
Phytoplankton species abundance in Lake Inba (Japan) from 1986 to 2016
Authors
Akemi Iwayama1, Hisako Ogura1, Yukio Hirama1, Chun-Wei Chang2,3, Chih-hao Hsieh2,4,5,6,7, and Maiko Kagami8*
- 1 Chiba Prefectural Environmental Research Center, Chiba, Japan
- 2 Taiwan International Graduate Program (TIGP)–Earth System Science Program, Academia Sinica, Taipei 11529, Taiwan
- 3 Taiwan International Graduate Program (TIGP)–Earth System Science Program, National Central University, Taoyuan 32001, Taiwan
- 4 Institute of Oceanography, National Taiwan University, Taipei 10617, Taiwan
- 5 Research Center for Environmental Changes, Academia Sinica, Taipei 11529, Taiwan
- 6 Institute of Ecology and Evolutionary Biology, Department of Life Science, National Taiwan University, Taipei 10617, Taiwan
- 7 National Center for Theoretical Sciences, Taipei 10617, Taiwan
- 8 Department of Environmental Science, Faculty of Science, Toho University, Chiba, Japan
*Corresponding author: Maiko Kagami
Department of
Environmental Science, Faculty of Science, Toho University, Chiba, Japan
Email: kagami@env.sci.toho-u.ac.jp
Tel: +81-47-472-1368
Fax: +81-47-472-1368
Department of
Environmental Science, Faculty of Science, Toho University, 2-2-1 Miyama,
Funabashi 274-8510, Chiba, Japan
Abstract
Lake Inba is one of the most eutrophic lakes in Japan. This data paper reports the abundance of phytoplankton species sampled biweekly from April 1986 to March 2016 at four stations in Lake Inba. Monitoring has been carried out by Chiba Prefectural Government, and phytoplankton count data have been collected since 1986. A total of 340 phytoplankton species were identified and enumerated by microscopy, as numbers of cells or colonies. The abundance of each species was expressed as cells per milliliter lake water. Total cell density ranged from 102 to 108 cells ml-1. The dominant cell class density was Cyanobacteria throughout the year. Cyanobacteria, such as Phormidium spp., Microcystis aeruginosa, and Anabaena spp. (Dolicospermum spp.), were the most dense in all months. The dominant cyanobacteria species reached concentrations of 107 cells ml-1. Diatoms, such as Aulacoseira granulata and A. ambigua, were also abundant, reaching 106 cells ml-1. These data can be used to appreciate how anthropogenic disturbances, such as eutrophication and global warming, affect density and community composition of phytoplankton.
Keywords
- Lake Inba
- Phytoplankton
- Eutrophication
- Algal bloom
- Diatom
- Cyanobacteria
- Seasonal succession
- Long-term monitoring
Introduction
Freshwater lakes provide important ecosystem services. However, eutrophication has progressed since the 1960s and 1970s in Japan, resulting in nuisance algal blooms appearing in many lakes. Long-term monitoring has been conducted in several lakes and reservoirs by the Japanese government to manage water quality since the 1970s. The monitored variables include chemical parameters, such as chemical oxygen demand (COD) and total nitrogen and phosphorus concentrations (TN and TP). In some lakes, biological parameters, such as plankton species composition, have been additionally monitored (Takamura and Nakagawa 2012; Tsai et al. 2014), as a change in phytoplankton species composition toward cyanobacteria indicates a serious social problem that includes toxins and odor.
Lake Inba is one of the most eutrophic lakes in Japan. It is the largest lake in Chiba Prefecture, with a surface area of 11.55 km2. This lake is an important water source for agriculture, industry, and the drinking water supply for Chiba Prefecture. Lake Inba is shallow and polymictic, with a maximum depth of 2.5 m (mean depth, 1.7 m), with no clear thermocline in summer. Eutrophication has progressed rapidly since the 1960s, and significant cyanobacterial blooms are observed during the summer ( Shiratori 2006). After the 1980s, the lake became less eutrophic, yet nitrogen and phosphorus concentrations remained high.
This study reports the long-term variations in the abundance of phytoplankton species, monitored twice monthly from April 1986 to March 2016 at four stations on Lake Inba. Phytoplankton have been monitored by Chiba Prefectural Government, and water quality measurements, such as TN and TP concentrations, have been taken since 1967. These data will be useful for future ecological and environmental studies.
METADATA
1. TITLE
Phytoplankton species abundance in Lake Inba (Japan) from 1986 to 2016
2. IDENTIFIER
ERDP-2017-04
3. CONTRIBUTORS
A. Principal investigator
Chiba Prefectural Government performed the field survey and cell counts, and the Chiba Prefectural Environmental Research Center analyzed the data and created the database.
B. Data set Owners
Chiba Prefectural Environmental Research Center is the owner of the data.
C. Data set Creators
- Maiko Kagami, Department of Environmental Science, Faculty of Science, Toho University
- Akemi Iwayama, Chiba Prefectural Environmental Research Center
- Hisako Ogura, Chiba Prefectural Environmental Research Center
- Chih-hao Hsieh, Institute of Oceanography, National Taiwan University
4. PROGRAM
A. Title
Measurement of water quality in public waters in Chiba Prefecture
B. Personal
Organization: Chiba Prefectural Environmental Research Center
Address: 3-5-1 Inagekaigan, Mihama-ku, Chiba 261-0005, Japan
Tel: +81 43-243-2935
Web address: https://www.pref.chiba.lg.jp/wit/
C. Funding
Chiba Prefectural Government, Japan
D. Objectives
The Chiba Prefectural Government has conducted monitoring of phytoplankton cell density and species composition in Lake Inba since 1986. This monitoring program has continued for more than 40 years to promote environmental and ecological studies.
5. GEOGRAPHIC COVERAGE
A. Geographic Description
Nishi-Inba (west basin), Kita-Inba (north basin), and the inflow (Aso-bashi) of Lake Inba, Japan.
B. Geographical Position
- Station 1: N35° 45′ 49″, E140° 08′ 42″ (Aso-bashi)
- Station 2: N35° 44′ 45″, E140° 11′ 33″ (Jousuidou-shusuikou-shita)
- Station 3: N35° 46′ 05″, E140° 12′ 33″ (Ipponmatsu-shita)
- Station 4: N35° 48′ 01″, E140° 15′ 07″ (Kitainbanuma-chuou)
6. TEMPORAL COVERAGE
A. Begin
April 1986
B. End
March 2016
7. TAXONOMIC COVERAGE
The data include 37 species (taxa) of Cyanophyceae (Cyanophyta), 192 Chlorophyceae (Chlorophyta), 3 Raphidophyceae (Heterokontophyta), 7 Euglenophyceae (Euglenozoa), 7 Dinophyceae (Dinophyta), 69 Bacillariophyceae (Heterokontophyta), 16 Chrysophyceae (Heterokontophyta), 5 Xanthophyceae (Heterokontophyta), and 4 Cryptophyceae (Cryptophyta).
8. METHODS
A. Study sites
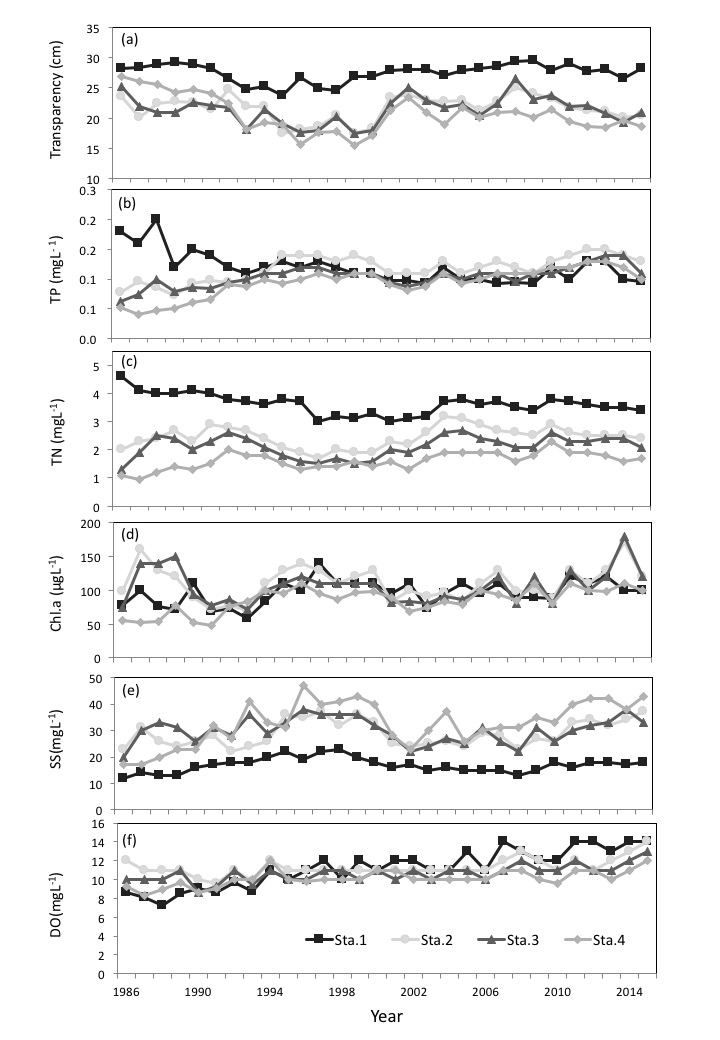
Lake Inba (Figure 1) is one of the most eutrophic lakes in Japan, and the largest lake in Chiba Prefecture (surface area, 11.55 km2; total volume, 19.7 million m3). Lake Inba is shallow (mean depth, 1.7 m, maximum depth, 2.5 m), with a catchment area of 541.1 km2. The lake is composed of a western basin and a northern basin. Monitoring has been conducted at two sites (Station 2 and 3) in the western basin, one site (Station 4) in the northern basin, and one site (Station 1) at the major inflow (Figure 1). The water quality monitoring program has been conducted by Chiba Prefectural Government (http://www.pref.chiba.lg.jp/suiho/kasentou/koukyouyousui/index.html : Note that the webpage is in Japanese). The annual means of transparency and concentrations of TP, TN, chlorophyll a (Chl.a), suspended solids (SS), and dissolved oxygen (DO) at the four sites from 1986 and 2016 are shown in Figure 2.
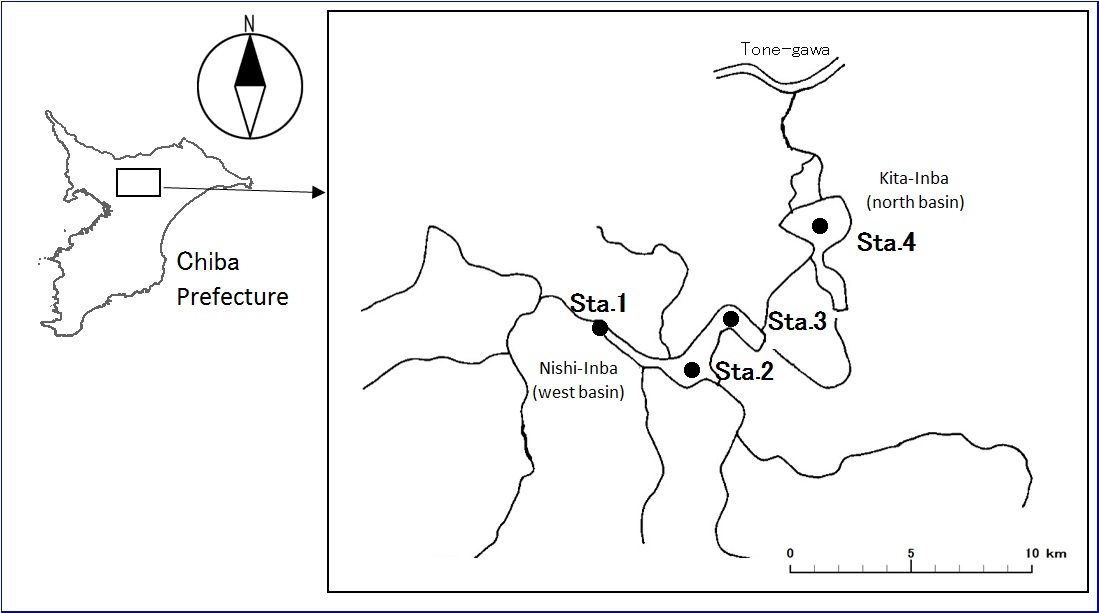
Fig. 1 Lake Inba sampling sites
B. Sampling, sample preservation, and counting methods
Water samples were taken twice monthly with a bucket at a depth of 0.5 m. The sample was immediately fixed with 1% glutaraldehyde. The number of cells or units (colonies) of each phytoplankton taxon was counted under an inverted microscope with a plankton counting chamber (0.1, 0.5, or 1 ml).
C. Taxonomy and systematics
The textbooks used for identification were Chihara (1997) and Mizuno and Takahashi (2000). Anabaena spp. were listed as Dolichospermum. Dolichospermum spp. were identified based on the shape of the akinates and alignment of the akinates and heterocysts inside the colony or filament. We identified colonies or filaments without akinates and heterocysts as Dolichospermum spp. We did not distinguish between Aphanizomenon and Raphidiopsis, and both were counted as Aphanizomenon. Microcystis spp. were divided into three species, such as M. aeruginosa , M. viridis and M. wesenbergii, based on colony morphology. Cyclotella and Stephanodiscus were not distinguished and both were counted as Thalassiosira of three size classes (5, 10, and 25 µm). Melosira spp. were listed as Aulacoseira.
D. Data verification procedures
The data were manually digitized and checked for typographical errors by the investigators.
9. DATA STATUS
A. Latest update
June 2016
The data span is from April 1986 to March 2016. Data will be collected continuously after March 2016, and the database will be updated as the data are verified.
B. Metadata status
Metadata are complete for this period and provided with the data.
10. ACCESSIBILITY
A. License and Usage Rights
1) Acceptable use. The data set should not be used for illegal purposes or to violate the rights of others. Use of the data set will be restricted to academic, research, educational, government, or other not-for-profit professional purposes.
2) Citation. Data users should properly cite this data paper in any publications or in the metadata of any derived data products that were produced using the data set. As the metadata and the data set can be updated at any time, the update date should be shown in the bibliography.
3) Acknowledgement. To support this long-term monitoring activity, data users should provide acknowledgements in any publications to whose content the data set contributed as follows: “Data for XXX” was provided by the Chiba Prefectural Environmental Research Center.
4) Notification. Data users should notify the Data set Contact when any study or publication based on or derived from the data set is distributed. Inform the Data set Contact with two reprints or a PDF file of any publications resulting from use of the data set.
5) Collaboration. Data users are strongly encouraged to consider consultation, collaboration, and/or coauthorship with the data owners.
6) Disclaimer. In no event shall the authors, data owners, or the Chiba Prefectural Environmental Research Center be liable for a loss of profits or for any indirect or incidental damages arising from the use or interpretation of the data.
B. Contact
Maiko Kagami
Department of
Environmental Science, Faculty of Science, Toho University, Miyama 2-2-1,
Funabashi 274-8510, Chiba, Japan
Email: kagami@env.sci.toho-u.ac.jp
Tel: +81-47-472-1368
Akemi Iwayama
Chiba Prefectural
Environmental Research Center, Water quality section, Inagekaigan
3-5-1, Mihama-ku, Chiba 261-0005 Japan
Email: suikankyo@pref.chiba.lg.jp
Tel: +81-43-243-2935
C. Storage location
The data owners and the Chiba Prefectural Environmental Research Center store the original data.
11. DATA STRUCTURE
A. Data tables
| Data file name | Description |
|---|---|
| SpeciesList.csv | Cell number per milliliter of lake water of the 340 taxa collected from Lake Inba |
| Inba_Phyto.csv | Species information table. |
B. Format type
The data files are in ASCII text, comma delimited (csv).
C. Header information
Headers corresponding to variable names (see section 11.D) are included in the first row of the data files.
D. Variable definitions
The variables are listed in the order they appear in the data file. The variable names are headers included as the first row in the data file.
| Data file name | Variable name | Variable definition |
|---|---|---|
| SpeciesList.csv | index | Identification of taxa (Sp. 1–340) |
| class | Identification of taxa (Class) | |
| species | Identification of taxa (genus or species) | |
| average.cell.number.per.colony | average cell number per colony (cells colony-1) |
| Data file name | Variable name | Variable definition |
|---|---|---|
| Inba_Phyto.csv | Year | Sampling year (1986–2016) |
| Month | Sampling month (1–12) | |
| Day | Sampling date (1–31) | |
| Station | Sampling site (1–4) | |
| Class | Identification of taxa (Class) | |
| Species_name | Identification of taxa (genus or species) | |
| cells_per_ml | Cell density (cells ml-1) |
12. SUPPLEMENTARY INFORMATION
The data in this data paper represent part of the water quality survey database of public water bodies in Chiba Prefecture. This monitoring program has been conducted by the Chiba Prefectural Environmental Research Center since 1967; therefore, the data in this data paper are identical to the data reported on the Chiba Prefecture website, Japan, written in Japanese (http://www.pref.chiba.lg.jp/suiho/kasentou/koukyouyousui/index.html). Chiba Prefectural Environmental Research Center measures selected environmental variables (water temperature, water depth, transparency, dissolved oxygen, pH), water quality (COD, S-COD, BOD, TOC, Chl.a, SS, TP, PO4-P, TN, NH4‐N, NO2‐N, and NO3‐N) and plankton (mainly phytoplankton, some rotifers and crustacean zooplankton).
13. ACKNOWLEDGMENTS
We are grateful to M. Hayakawa for comments on species identifications. We thank the editors, particularly Dr. Nakamura, and the two anonymous reviewers for their constructive comments and suggestions. This study was supported by JSPS KAKENHI Grant Numbers 16H02943.
14. LITERATURE CITED
Chihara M (1997) Biology of Algal Diversity (in Japanese). Uchida Rokakuho Publ. Co. Ltd, Tokyo.
Mizuno T, Tahakashi E (2000) An Illustrated Guide to Freshwater Zooplankton in Japan (in Japanese). Tokai University Press, Tokyo.
Siratori K (2006) Ikiteiru Inba-numa (in Japanese). Ronshobou, Chiba.
Takamura N, Nakagawa M (2012) Phytoplankton species abundance in Lake Kasumigaura (Japan) monitored monthly or biweekly since 1978. Eco Res 27: 837-837.
Tsai CH, Miki T, Chang, CW, Ishikawa K, Ichise S, Kumagai M, Hsieh CH (2014) Phytoplankton functional group dynamics explain species abundance distribution in a directionally changing environment. Ecology 95: 3335-3343.
