Metadata
Title
Seasonality of leaf litter and leaf area index data for various tree species in a cool-temperate deciduous broad-leaved forest, Japan, 2005–2014
Authors
Shin Nagai1§*, Kenlo Nishida Nasahara2§, Shinpei Yoshitake3, Taku M. Saitoh3
- Department of Environmental Geochemical Cycle Research, Japan Agency for Marine-Earth Science and Technology, 3173-25 Showa-machi, Kanazawa-ku, Yokohama, Kanagawa 236-0001, Japan
- Faculty of Life and Environmental Sciences, University of Tsukuba, 1-1-1 Tennodai, Tsukuba, Ibaraki 305-8572, Japan
- River Basin Research Center, Gifu University, 1-1 Yanagido, Gifu 501-1193, Japan
§ These authors contributed equally to this work.
*Corresponding author: Dr. Shin NAGAI
Department of Environmental Geochemical Cycle Research,
Japan Agency for Marine-Earth Science and Technology,
3173-25 Showa-machi, Kanazawa-ku, Yokohama, Kanagawa 236-0001, Japan.
Tel: +81(45)778-5594
Fax: +81(45)778-5706
E-mail: nagais@jamstec.go.jp
Abstract
This paper reports seasonal data regarding leaf litter for 14 deciduous broad-leaved species and one evergreen coniferous species as well as leaf area index (LAI) data for the 14 deciduous broad-leaved species in a cool-temperate deciduous broad-leaved forest in Japan. The seasonal leaf biomass of various tree species is important for accurately evaluating ecosystem functions such as photosynthesis and evapotranspiration under climate change. However, there is a lack of freely available, long-term data. We collected litterfall every 1 to 4 weeks from September or October to November or December each year from 2005 to 2014 in Takayama, Japan (36° 08′ 46″N, 137° 25′ 23″E, 1420 m a.s.l.). After sorting the litter into leaves (according to species categories), stems + branches, and "other", we dried and weighed the litter groups. We also collected seasonal leaf data (number of leaves and leaf length and width) for each broad-leaved species, which we recorded every 1 to 4 weeks from April or May to October or November using multiple target shoots. To estimate the LAI in autumn for each deciduous broad-leaved species, we used a semi-empirical model of the vertical integration of leaf dry mass per unit leaf area. To estimate the LAI in spring and summer, we used the relationship between the LAI in autumn and the seasonal leaf data. Our data provide input, calibration, and validation parameters for determining LAI based on satellite remote-sensing observations or radiative transfer models and for use in ecosystem models.
Key words
- Deciduous broad-leaved forest
- ground-truth
- leaflitter
- leaf area index (LAI)
- leaf mass per area
- leaf seasonality
- Japan
- semi-empirical model
- species discrimination
- a decade data set
Introduction
Seasonality of leaf biomass is an important ecophysical parameter with which to evaluate ecosystem functions (photosynthesis and evapotranspiration) and forest structure. Leaf area index (LAI), defined as the total area of leaves (on a single side) per unit ground area, is an important spatial variable. At the plot scale, LAI is evaluated by destructive sampling ( Monsi and Saeki 2005) and non-destructive remote sensing of light conditions by digital camera or light sensors (Ryu et al. 2014). At the regional and global scales, LAI is evaluated from the empirical relationship between a satellite-observed vegetation index and leaf biomass or from a radiative transfer model using satellite-observed canopy reflectance data (Kobayashi et al. 2007; Zhu et al. 2013). LAI has been measured in situ around the world (Iio et al. 2014).
However, LAI includes many uncertainties caused by methods of observation (Richardson et al. 2011). For instance, when it is evaluated from the vertical relationship between light conditions (i.e., exponential reduction of transmittance) and leaf biomass within a forest, LAI is affected by clumping of leaves, stems, and branches ( Ryu et al. 2012). This method can evaluate the LAI of a whole canopy (strictly speaking, for a circle within a radius of 5 to 10 m at the observation point), but not of individual trees. On the other hand, leaf longevity (i.e., from leaf flush to leaf fall), which correlates well with climate, leaf traits, and photosynthesis, differs among tree species (Kikuzawa 1991; Wright et al. 2004; Onoda et al. 2011). To accurately evaluate the responsibility of photosynthesis capacity and growing period to climate change, we need seasonal in situ leaf biomass and LAI of forests and individual trees.
This paper reports seasonal data of leaf litter for 14 deciduous broad-leaved species and 1 evergreen coniferous species and LAI for 14 deciduous broad-leaved species in a cool-temperate deciduous broad-leaved forest in Japan. LAI was evaluated by integrative analysis of a semi-empirical model for the vertical integration of leaf dry mass per unit leaf area in autumn and the relationship between LAI in autumn and seasonality data of leaf number and leaf size, which were recorded every 1 to 4 weeks from April or May to October or November during 1 to 10 years from 2005 to 2014 from multiple shoots (Nasahara et al. 2008; Nagai and Nasahara 2017). These data will be useful for the validation of LAI based on satellite remote-sensing and for the input, calibration, and validation of models for the evaluation of ecosystem functions. The year-to-year variability of leaf litter and LAI among various deciduous broad-leaved species will improve ecologists' understanding of year-to-year responses of photosynthesis and plant phenology to climate change.
Metadata
1. TITLE
Seasonality of leaf litter and leaf area index data for various tree species in a cool-temperate deciduous broad-leaved forest, Japan, 2005–2014
2. IDENTIFIER
ERDP-2017-02
3. CONTRIBUTOR
A. Data Set Owner
Leaf litter:
Shin NAGAI
Department of Environmental Geochemical Cycle Research,
Japan Agency for Marine-Earth Science and Technology
Address:
3173-25 Showa-machi, Kanazawa-ku, Yokohama, Kanagawa 236-0001, Japan
Tel.: +81(45)778-5594
Fax: +81(45)778-5706
E-mail: nagais@jamstec.go.jp
LAI:
Kenlo Nishida Nasahara
Faculty of Life and Environmental Sciences, University of Tsukuba
Address:
1-1-1 Tennodai, Tsukuba, Ibaraki 305-8572, Japan
Tel./Fax: +81(29)853-4897
E-mail: 24dakenlo@gmail.com
B. Contact Person
Leaf litter:
Shin NAGAI
Department of Environmental Geochemical Cycle Research,
Japan Agency for Marine-Earth Science and Technology
Address:
3173-25 Showa-machi, Kanazawa-ku, Yokohama, Kanagawa 236-0001, Japan
Tel.: +81(45)778-5594
Fax: +81(45)778-5706
E-mail: nagais@jamstec.go.jp
LAI:
Kenlo Nishida Nasahara
Faculty of Life and Environmental Sciences, University of Tsukuba
Address:
1-1-1 Tennodai, Tsukuba, Ibaraki 305-8572, Japan
Tel./Fax: +81(29)853-4897
E-mail: 24dakenlo@gmail.com
4. PROJECTS
A. Titles
- Environment Research and Technology Development Fund (S-1; Integrated Study for Terrestrial Carbon Management of Asia in the 21st Century Based on Scientific Advancement)
- 21st Century COE Program (Satellite Ecology, Gifu University)
- JSPS-NRF-NSFC A3 Foresight Program
- Development of integrative information of the terrestrial ecosystem
- Validation of terrestrial ecological information from GCOM-C (PI#116)
- Development of evaluation of ecosystem functioning in deciduous forests by satellite remote sensing
B. Personal
Projects 1, 4, and 5.
Kenlo Nishida Nasahara
Faculty of Life and Environmental Sciences, University of Tsukuba
Address: 1-1-1 Tennodai, Tsukuba, Ibaraki 305-8572, Japan
Tel./Fax: +81(29)853-4897
E-mail: 24dakenlo@gmail.com
Projects 2 and 3.
Hiroyuki Muraoka
River Basin Research Center, Gifu University
Address:
1-1 Yanagido, Gifu 501-1193, Japan
E-mail:
muraoka@green.gifu-u.ac.jp
Project 6.
Shin Nagai
Department of Environmental Geochemical Cycle Research,
Japan Agency for Marine-Earth Science and Technology
Address:
3173-25 Showa-machi, Kanazawa-ku, Yokohama, Kanagawa 236-0001, Japan
Tel.: +81(45)778-5594
Fax: +81(45)778-5706
E-mail: nagais@jamstec.go.jp
C. Funding
- Ministry of the Environment of Japan
- Japan Society for the Promotion of Science (JSPS)
- JSPS
- Global Change Observation Mission (GCOM) of the Japan Aerospace Exploration Agency (JAXA)
- GCOM of JAXA
- JSPS
5. GEOGRAPHIC COVERAGE
A. Geographic Description
Takayama, Gifu, Japan
B. Geographical Position:
36° 08′ 46″ N, 137° 25′ 23″ E (WGS84)
6. TEMPORAL COVERAGE
A. Begin
3 October 2005 (leaf litter)
4 May 2005 (LAI)
B. End
17 October 2014 (leaf litter and LAI)
7. METHODS
A. Study sites
We collected litterfall and LAI data in a 60-year-old cool-temperate deciduous secondary forest in Takayama, central Japan (36° 08′ 46″ N, 137° 25′ 23″ E, 1420 m a.s.l.). The site is part of the AsiaFlux network (http://asiaflux.net), the Japan Long-Term Ecological Research network (http://www.jalter.org), and the Phenological Eyes Network (http:// www.pheno-eye.org). The dominant canopy species are Betula ermanii Cham., Betula platyphylla Sukachev var. japonica Hara, and Quercus crispula Blume. Within a 1-ha permanent plot (Fig. 1), 40 deciduous broad-leaved species and 3 evergreen coniferous species grow (Ohtsuka et al. 2005). The evergreen dwarf bamboo Sasa senanensis Rehder, which reaches 1 to 2 m tall, fully covers the forest floor. The height of the forest canopy is 13 to 18 m. An 18-m-tall canopy access tower was located just outside the southeastern corner of the plot. This study site is described in detail in Ohtsuka et al. (2005), Nagai et al. (2014), and Saitoh et al. (2015).
B. Measurement methods
B-1. Leaf litter
We installed 14 litter traps within the 1-ha permanent plot in 1999. Each trap had a square aperture of 1 m × 1 m at 1 m height. We selected the locations of traps to cover typical topographic conditions (i.e., ridge, side slope, and valley) within the plot, and installed 2 extra traps around the canopy access tower in 2008 (Fig. 1). We collected litterfall (leaves, branches, fruit, and seeds) every 1 to 4 weeks from September or October (from June in one year) to November or December (Table 1). We sorted the litter into the leaves of 16 species categories (Table 2), stems + branches, and "other" (fruit and seeds), and then stored it in paper bags. After drying in an oven at 70℃ for >48 to 72 h, we weighed the bags of litter on electronic scales. We then subtracted the mean weight of 10 dried bags. This litterfall is described in Nasahara et al. (2008) and in Nagai et al. (2014, 2015).
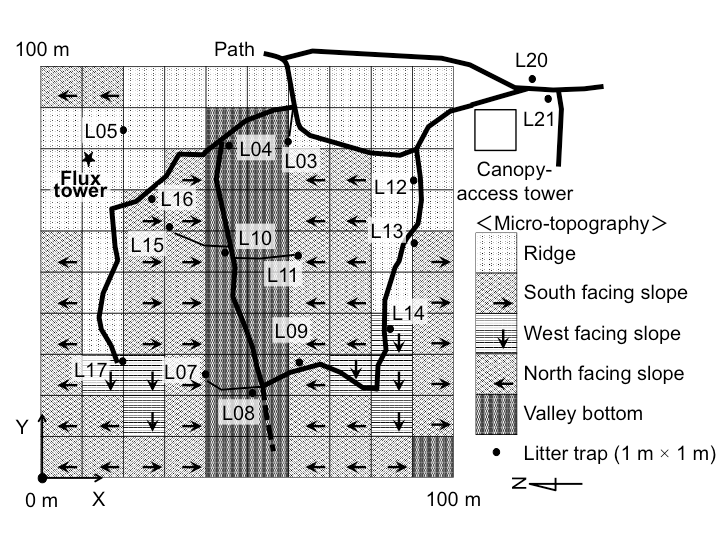
Figure 1. Locations of litter traps
| Year | Date |
|---|---|
| 2005 | 22 Sep., 3 Oct., 12 Oct., 18 Oct., 24 Oct., 1 Nov., 12 Nov. |
| 2006 | 20 June, 21 July, 25 Aug., 17 Sep., 30 Sep., 9 Oct., 22 Oct., 4 Nov., 18 Nov. |
| 2007 | 25 Sep., 18 Oct., 3 Nov., 29 Nov. |
| 2008 | 28 Sep., 7 Oct., 13 Oct., 20 Oct., 25 Oct., 31 Oct., 3 Nov., 10 Nov., 13 Nov. |
| 2009 | 25 Sep., 12 Oct., 29 Oct., 10 Nov., 28 Nov., 7 Dec. |
| 2010 | 30 Sep., 12 Oct., 3 Nov., 18 Nov., 21 Dec. |
| 2011 | 3 Oct., 17 Oct., 3 Nov., 24 Nov. |
| 2012 | 28 Sep., 16 Oct., 30 Oct., 3 Dec. |
| 2013 | 30 Sep., 21 Oct., 31 Oct., 29 Nov. |
| 2014 | 30 Sep., 8 Oct., 31 Oct., 28 Nov. |
| Tree groups | Tree species |
|---|---|
| Dominant | Betula group*: Betula ermanii Cham., B. platyphylla Sukachev var. japonica Hara, B. maximowicziana Regel |
| Quercus crispula Blume | |
| Aria alnifolia (Sieb. et Zucc.) Decne. | |
| Magnolia obovata Thunb. | |
| Fagus crenata Blume | |
| Prunus maximowiczii Ruprecht | |
| Tilia japonica (Miq.) Simonkai | |
| Evergreen conifer species: Abies homolepis Sieb. et Zucc., Pinus parviflora Sieb. et Zucc., Chamaecyparis pisifera (Sieb. et Zucc.) Endl. | |
| Codominant | Acer distylum Sieb. et Zucc. |
| Acer rufinerve Sieb. et Zucc. | |
| Eleutherococcus sciadophylloides (Franch. et Savat.) Ohashi | |
| Kalopanax septemlobus (Thunb.) Koidz. | |
| Other Acer species: Acer mono Maxim. var. marmoratum (Nichols.) Hara f. dissectum (Wesmael) Rehder, A. micranthum Sieb. et Zucc., A. japonicum Thunb., A. sieboldianum Miq., A. argutum Maxim. | |
| Other deciduous species: Symplocos coreana (Lév.) Ohwi, Salix bakko Kimura, Fraxinus lanuginosa Koidz. f. serrata (Nakai) Murata, Sorbus commixta Hedl., Toxicodendron trichocarpum (Miq.) Kuntze, Prunus jamasakura Sieb. ex Koidz., Populus sieboldii Miq., Benthamidia japonica (Sieb. et Zucc.) Hara, Castanea crenata Sieb. et Zucc., Phellodendron amurense Rupr., Swida controversa (Hemsl.) Soják, Ilex macropoda Miq., Carpinus japonica Blume, Lindera umbellata Thunb., Magnolia salicifolia (Sieb. et Zucc.) Maxim., Euonymus oxyphyllus Miq., Aesculus turbinata Blume | |
| Understory | Hydrangea paniculata Sieb. et Zucc. |
| Viburnum furcatum Blume ex Maxim. | |
| Sasa senanensis Rehder |
*We grouped B. ermanii, B. platyphylla, and B. maximowicziana into a single Betula group because it was difficult to distinguish among them.
B-2. Leaf area index
We estimated LAI in autumn based on the litterfall data in 14 litter traps (i.e., excluded L20 and L21) and leaf dry mass per unit leaf area (LMA). We estimated LMA of each species from leaf samples (2 to 13 leaves from the top and 2 to 8 leaves from the bottom) taken from August to October in 2006 and 2007 (Table 3; Nasahara et al. 2008).
We estimated LAI in spring and summer from the relationship between LAI in autumn and the relative seasonality of leaf area (as a proportion of the annual maximum value at each point in time) for each deciduous broad-leaved species. To obtain seasonality, we counted the leaves and measured their width and length on multiple target shoots every 1 to 4 weeks from April or May to October or November during 1 to 10 years (Table 4; Nasahara et al. 2008; Nagai and Nasahara 2017). We sampled 4 dominant (B. ermanii, Q. crispula, M. obovata, P. maximowiczii) and 2 codominant species (A. rufinerve, E. sciadophylloides) from the canopy access tower, and 3 dominant (A. alnifolia, F. crenata, T. japonica), 1 codominant (A. distylum), and 2 understory species (H. paniculata, V. furcatum) from the forest floor (Table 5). On each target shoot (1 to 3 shoots per tree), we counted the leaves and measured the length and width of 10 to 20 leaves from the top of the shoot to a colored tape tied to the shoot. To evaluate individual differences, we assessed 2 to 4 individuals of 3 dominant (B. ermanii, Q. crispula, A. alnifolia), 1 codominant (A. distylum), and 2 understory species (H. paniculata, V. furcatum). To evaluate differences between sunlit and shaded leaves of B. ermanii and Q. crispula, we assessed 1 to 4 shoots in the sunlit (top) canopy and in the shaded lower (bottom) canopy (Table 5). All the seasonality data is published in Nagai and Nasahara (2017).
To evaluate the relative seasonality of leaf area of each deciduous broad-leaved species, first we multiplied the number of leaves by the average leaf area (approximated as an ellipse; n = 10–20) of each target shoot on each observation date in each year. When we could not count the leaves and measure their width and length on target shoot in the same date, we adjusted the date. Second we calculated the relative seasonality (whereby the annual maximum of "number of leaves × average of leaf area" = 1) of each target shoot in each year. Finally we averaged the relative seasonality of target shoots for each deciduous broad-leaved species. For the Betula group and Q. crispula, we averaged the relative seasonality of target shoots in the sunlit (top) canopy and in the shaded lower (bottom) canopy. In the absence of data (e.g., "Aa" in 2005–2006 and 2009–2014), we used the average value of dominant and codominant species as surrogates (e.g., in 2005, the average of "Be", "Qc", "Fc", "Ad", and "Ar").
To estimate LAI in spring and summer, we multiplied the average relative seasonality of leaf area (0–1, linearly interpolated at a daily time step) by LAI in autumn for each deciduous broad-leaved species. For the Betula group and Q. crispula, we evaluated LAI in sunlit and shaded leaves, and present the total LAI calculated from sunlit and shaded leaves.
LAI is described in Nasahara et al. (2008), in Nagai et al. (2011, 2014), and in Potithep et al. (2013).
| ID | Average (g⋅m-2) | Stderr (g⋅m-2) | Species name | Data origin |
|---|---|---|---|---|
| Ad | 33.37 | 0.89 | Acer distylum | Measured |
| Ar | 45.72 | 1.60 | Acer rufinerve | Measured |
| Be | 76.28 | 1.38 | Betula ermanii | Measured |
| Fc | 64.93 | 2.59 | Fagus crenata | Measured |
| Hp | 31.87 | 1.01 | Hydrangea paniculata | Measured |
| Mo | 64.92 | 0.14 | Magnolia obovata | Measured |
| Qc | 69.71 | 2.93 | Quercus crispula | Measured |
| Es | 34.57 | 0.29 | Eleutherococcus sciadophylloides | Measured |
| Vf | 43.40 | 1.14 | Viburnum furcatum | Measured |
| Ks | 68.96 | 2.60 | Kalopanax septemlobus | Average of Be, Fc, Mg, and Qc (canopy trees) |
| Aa | 37.64 | 8.50 | Aria alnifolia | Average of Hp and Vf |
| Tj | 68.96 | 2.60 | Tilia japonica | Average of Be, Fc, Mg, and Qc (canopy trees) |
| oa | 39.50 | 9.10 | Other Acer trees | Average of Ar and Ad |
| ob | 37.64 | 8.50 | Other broad-leaved trees | Average of Hp and Vf |
Note: LMA was average of top and bottom leaves.
| Year | Date | Number of observation times |
|---|---|---|
| 2005 | 4 May, 13 May, 18–19 May, 21–22 May, 25–26 May, 31 May–1 June, 4 June, 10 June, 10–11 July, 24 Aug., 25–26 Sept., 12 Oct., 18 Oct., 1 Nov, 12 Nov. | 16 |
| 2006 | 12 May, 22–23 May, 2 June, 16–17 June, 29–30 June, 30 July, 18 Aug., 17 Sept., 30 Sept., 9 Oct., 22 Oct., 5 Nov. | 12 |
| 2007 | 3 May, 13 May, 22–23 May, 1 June, 11–12 June, 9 July, 4–6 Aug., 11–12 Sept., 24 Sept., 18 Oct., 3 Nov., 22 Nov. | 12 |
| 2008 | 29 Apr, 15 May, 26–27 May, 7–9 June, 7 July, 5–7 Aug., 26–27 Sept., 15–16 Sept., 27–28 Sept., 5–7 Oct., 12–13 Oct., 20 Oct., 25 Oct., 31 Oct., 3 Nov., 10 Nov., 13 Nov., 27 Nov. | 18 |
| 2009 | 28 Apr, 20 May, 1 June, 21 June, 2 July, 14 July, 11 Aug., 16 Sept., 1 Oct., 12–13 Oct., 29 Oct., 10 Nov. | 12 |
| 2010 | 4 May, 16 May, 28 May, 9 June, 27 June, 17 July, 11 Aug., 1 Sept., 21 Sept., 12 Oct., 3 Nov., 18 Nov. | 12 |
| 2011 | 25 Apr, 16 May, 24 May, 5 June, 19 June, 10 July, 24 July, 16 Aug., 12 Sept., 3 Oct., 17 Oct., 30 Oct., 13 Nov. | 13 |
| 2012 | 24 May, 5 June, 16 July, 14 Sept., 16 Oct., 29 Oct. | 6 |
| 2013 | 16 May, 31 May, 1 July, 16 Aug., 24 Sept., 7 Oct., 21 Oct. | 7 |
| 2014 | 14 May, 23 May, 3 June, 30 June, 3 Sep, 8 Oct., 17 Oct. | 7 |
Note: These observation dates are described in Nagai and Nasahara (2017).
| Tree group | ID | Tree species | Number of shoots | Number of individuals | Observation period |
|---|---|---|---|---|---|
| Dominant | Be | Betula ermanii | 7 | 4 | 2005–2014 |
| Qc | Quercus crispula | 8 | 4 | 2005–2014 | |
| Aa | Aria alnifolia | 2 | 2 | 2007–2008 | |
| Fc | Fagus crenata | 1 | 1 | 2005–2008 | |
| Mo | Magnolia obovata | 1 | 1 | 2006–2008, 2011 | |
| Tj | Tilia japonica | 1 | 1 | 2008 | |
| Pm | Prunus maximowiczii | 1 | 1 | 2005 | |
| Codominant | Ad | Acer distylum | 2 | 2 | 2005–2011 |
| Ar | Acer rufinerve | 1 | 1 | 2005–2008 | |
| Es | Eleutherococcus sciadophylloides | 1 | 1 | 2007–2008 | |
| Understory | Hp | Hydrangea paniculata | 3 | 3 | 2005–2014 |
| Vf | Viburnum furcatum | 3 | 3 | 2005–2014 |
Note: We grouped P. maximowiczii into "other" broad-leaved trees. These sample shoots for leaf-seasonality observation are described in detailed in Nagai and Nasahara (2017).
8. DATA STRUCTURE
A. Format type
The data files are formatted in comma-separated values (csv) format.
B. Naming rules of the data files
B-1. Leaf litter
The data files are named "2005_2014_TKY_litter_Sp_corrected.csv", where Sp is the two-letter abbreviation of the species:
- Aa: A. alnifolia
- Ad: A. distylum
- Ar: A. rufinerve
- Be: Betula group
- Es: E. sciadophylloides
- Fc: F. crenata
- Hp: H. paniculata
- Ks: K. septemlobus
- Mo: M. obovata
- Qc: Q. crispula
- Tj: T. japonica
- Vf: V. furcatum
- co: evergreen coniferous species
- oa: other Acer species
- ob: other deciduous species
B-2. LAI
The data files are named "2005_2014_TKY_LAI_Sp.csv", where Sp is the two-letter abbreviation of the species. "co" is not included for the LAI.
C. Header information
C-1. Leaf litter
Line 1 describes the dataset (labeled # at the start of line).
C-2. LAI
Line 1 describes the dataset (labeled # at the start of line).
D. Data sequence
D-1. Leaf litter
In data file "2005_2014_TKY_litter_Sp_corrected.csv", the columns include the following data:
| Variable name | Unit | Variable definition |
|---|---|---|
| Date | – | Year/month/day |
| DOY | – | Day of year |
| L12 | g | Dry weight in litter trap L12 |
| L13 | g | Dry weight in litter trap L13 |
| L14 | g | Dry weight in litter trap L14 |
| L03 | g | Dry weight in litter trap L03 |
| L11 | g | Dry weight in litter trap L11 |
| L09 | g | Dry weight in litter trap L09 |
| L04 | g | Dry weight in litter trap L04 |
| L10 | g | Dry weight in litter trap L10 |
| L08 | g | Dry weight in litter trap L08 |
| L16 | g | Dry weight in litter trap L16 |
| L15 | g | Dry weight in litter trap L15 |
| L07 | g | Dry weight in litter trap L07 |
| L17 | g | Dry weight in litter trap L17 |
| L05 | g | Dry weight in litter trap L05 |
| L20 | g | Dry weight in litter trap L20 |
| L21 | g | Dry weight in litter trap L21 |
Note: Sp is the two-letter abbreviation of the species. "corrected" (in filename) means that our open data is a higher-level data product. "Hp" in 2005 and 2006 includes litterfall in other deciduous broad-leaved species because we misclassified. NA means "not available". In this data paper, we don't open the litterfall data in evergreen dwarf bamboo S. senanensis because the litterfall was very little.
D-2. Leaf area index
In data file "2005_2014_TKY_LAI_Sp.csv", the columns include the following data:
| Variable name | Unit | Variable definition |
|---|---|---|
| Date | – | Year/month/day |
| LAI | m2⋅m-2 | Average of LAI in Sp |
| stderr | m2⋅m-2 | Standard error of LAI in Sp |
Note: Sp is the two-letter abbreviation of the species. No LAI data in "Ks" in 2011 because of no litterfall. "Hp" in 2005 and 2006 includes LAI in other deciduous broad-leaved species because we misclassified litterfall in "Hp".
9. ACCESSIBILITY
License
This dataset is provided under a Creative Commons Attribution 4.0 International license (CC-BY 4.0) (https://creativecommons.org/licenses/by/4.0/).
10. ACKNOWLEDGMENTS
We are grateful to K. Kurumado, Y. Miyamoto, and H. Muraoka (River Basin Research Center, Gifu University), H. Mikami (University of Tsukuba), T. Motohka (Japan Aerospace Exploration Agency), T. Inoue (Japan Agency for Marine-Earth Science and Technology), and all Takayama community members for their assistance in the field. We are grateful for the editor and the two anonymous reviewers for their constructive comments and suggestions. This study was supported by a KAKENHI Grant-in-Aid for Scientific Research (B) from the Japan Society for the Promotion of Science (#15H04512).
11. LITERATURE CITED
Iio A, Hikosaka K, Anten NPR, Nakagawa Y, Ito A (2014) Global dependence of field-observed leaf area index in woody species on climate: a systematic review. Global Ecol Biogeogr 23:274–285
Kikuzawa K (1991) A cost-benefit analysis of leaf habit and leaf longevity of trees and their geographical pattern. The American Naturalist 138:1250–1263
Kobayashi H, Suzuki R, Kobayashi S (2007) Reflectance seasonality and its relation to the canopy leaf area index in an eastern Siberian larch forest: Multi-satellite data and radiative transfer analyses. Remote Sens Environ 106:238–252
Monsi M, Saeki T (2005) On the factor light in plant communities and its importance for matter production. Ann Bot 95:549–567 (originally published in German in Jpn J Bot 14:22–52, 1953).
Nagai S, Maeda T, Gamo M, Muraoka H, Suzuki R, Nasahara KN (2011) Using digital camera images to detect canopy condition of deciduous broad-leaved trees. Plant Ecol Divers 4:78–88
Nagai S, Inoue T, Ohtsuka T, Kobayashi H, Kurumado K, Muraoka H, Nasahara KN (2014) Relationship between spatio-temporal characteristics of leaf-fall phenology and seasonal variations in near surface- and satellite-observed vegetation indices in a cool-temperate deciduous broad-leaved forest in Japan. Int J Remote Sens 35:3520–3536
Nagai S, Inoue T, Ohtsuka T, Yoshitake S, Nasahara KN, Saitoh TM (2015) Uncertainties involved in leaf fall phenology detected by digital camera. Ecol Inform 30:124–132
Nagai S, Nasahara KN (2017) Seasonal leaf phenology data for 12 tree species in a cool-temperate deciduous broadleaved forest in Japan from 2005 to 2014. Ecol Res: in press
Nasahara KN, Muraoka H, Nagai S, Mikami H (2008) Vertical integration of leaf area index in a Japanese deciduous broad-leaved forest. Agric For Meteorol 148:1136–1146
Ohtsuka T, Akiyama T, Hashimoto Y, Inatomi M, Sakai T, Jia S, Mo W, Tsuda S, Koizumi H (2005) Biometric based estimates of net primary production (NPP) in a cool-temperate deciduous forest stand beneath a flux tower. Agric For Meteorol 134:27–38
Onoda Y, Westoby M, Adler PB, Choong AMF, Clissold FJ, Cornelissen JHC, Diaz S, Dominy NJ, Elgart A, Enrico L, Fine PVA, Howard JJ, Jalili A, Kitajima K, Kurokawa H, McArthur C, Lucas PW, Markesteijn L, Perez-Harguindeguy N, Poorter L, Richards L, Santiago LS, Sosinski EE, Van Bael SA, Warton DI, Wright IJ, Wright SJ, Yamashita N (2011) Global patterns of leaf mechanical properties. Ecol Lett 14:301–312
Potithep S, Nagai S, Nasahara KN, Muraoka H, Suzuki R (2013) Two separate periods of the LAI–VIs relationships using in situ measurements in a deciduous broadleaf forest. Agric For Meteorol 169:148–155
Richardson AD, Dail DB, Hollinger DY (2011) Leaf area index uncertainty estimates for model–data fusion applications. Agric For Meteorol 151:1287–1292
Ryu Y, Verfaillie J, Macfarlane C, Kobayashi H, Sonnentag O, Vargas R, Ma S, Baldocchi DD (2012) Continuous observation of tree leaf area index at ecosystem scale using upward-pointing digital cameras. Remote Sens Environ 126:116–125
Ryu Y, Lee G, Jeon S, Song Y, Kimm H (2014) Monitoring multi-layer canopy spring phenology of temperate deciduous and evergreen forests using low-cost spectral sensors. Remote Sens Environ 149:227–238
Saitoh TM, Nagai S, Yoshino J, Kondo H, Tamagawa I, Muraoka H (2015) Effects of canopy phenology on deciduous overstory and evergreen understory carbon budgets in a cool-temperate forest ecosystem under ongoing climate change. Ecol Res 30:267–277
Wright IJ, Reich PB, Westoby M, Ackerly DD, Baruch Z, Bongers F, Cavender-Bares J, Chapin T, Cornelissen JHC, Diemer M, Flexas J, Garnier E, Groom PK, Gulias J, Hikosaka K, Lamont BB, Lee T, Lee W, Lusk C, Midgley JJ, Navas M-L, Niinemets U, Oleksyn J, Osada N, Poorter H, Poot P, Prior L, Pyankov VI, Roumet C, Thomas SC, Tjoelker MG, Veneklaas EJ, Villar R (2004) The worldwide leaf economics spectrum. Nature 428:821–827
Zhu Z, Bi J, Pan Y, Ganguly S, Anav A, Xu L, Samanta A, Piao S, Nemani RR, Myneni RB (2013) Global data sets of vegetation leaf area index (LAI)3g and fraction of photosynthetically active radiation (FPAR)3g derived from global inventory modeling and mapping studies (GIMMS) normalized difference vegetation index (NDVI3g) for the period 1981 to 2011. Remote Sens 5:927–948
