Metadata
Title
5- and 10-km mesh datasets of agricultural land use based on governmental statistics for 1970–2005.
Running title
Agricultural mesh datasets
Name of authors
Takeshi OSAWA12*, Taku KADOYA3, Kazunori KOHYAMA1
Affiliations
1: National Institute for Agro-Environmental Sciences, Japan
2: Japan node of the Global Biodiversity Information Facility
3: National Institute for Environmental Studies, Japan
*: Corresponding author:
TEL: +81.78.803.8148
FAX: +81.78.803.8199
E-mail: arosawa@gmail.com
Abstract
Land use data serve as an essential part of large-scale ecological research, such as landscape ecology and macroecological studies. For agricultural fields in Japan, existing time series statistical records can be used to convert map data according to a map of municipality units. In this data paper, we determined the areas of agricultural land use in Japan from 1970 to 2005, excluding small islands, at spatial resolutions of 5- and 10-km mesh grid units, which are often referred to as the Five-fold Mesh and Japanese Second-order Mesh, respectively. The elements considered included total farmland, paddy fields, dry farmland, and orchards. In 2005, we included abandoned agricultural areas because the related data were available in the agricultural statistical records. The source data came from the Census for Agriculture, Forestry and Fisheries conducted by the Ministry of Agriculture, Forestry and Fisheries, Japan. The Datum was the Japanese Geodetic Datum 2000 (JGD2000). All of the datasets have open data licenses under the rules of the Creative Commons CC-BY 4.0 International (https://creativecommons.org/licenses/by/4.0/legalcode).
Keywords
- agricultural abandonment
- agriculture
- five-fold mesh
- land cover
- land use
- open data
- second-order mesh
- standard mesh
- time-series records
Metadata
Introduction
About 38% of the Earth’s terrestrial surface is used for agriculture, making it the largest land use on the planet (Foley et al. 2011). In agricultural ecosystems, land use changes influence various components and processes, such as biodiversity, soil and water resources, and landscape fragmentation (De Groot et al. 2002; Kamusoko & Aniya 2007; Ries 2010; Zimmermann et al. 2010).
Land use data are essential in large-scale ecological research, such as landscape ecology and macroecological studies, and several land use datasets have been compiled for Japan (Akasaka et al. 2014). For example, a vegetation map released by the Integrated Biodiversity Information System (Ministry of the Environment, Japan) has been used for several studies related to landscape ecology (e.g., Osawa et al. 2011b; Katayama et al. 2014). A land use map released by the National Land Numerical Information Download Service, Japan (Matsuda 1980; Yaguchi 1990; Ministry of Land, Infrastructure, Transport and Tourism, Japan) has also been used (e.g., Tsuji et al. 2011). This type of data is also useful for studies of global warming, socio-economics, and land use planning.
For agricultural fields in Japan, the time series of statistical records provided by the Census for Agriculture, Forestry and Fisheries (CAFF) can be used to convert map data based on municipality units map (Ministry of Agriculture, Forestry and Fisheries). However, this dataset cannot be easily applied in the field of ecology because the data units, namely old municipality units, cannot be easily converted into standard ecological units. Ecological data such as species occurrences have often been gathered for standard units, such as the standard Japanese mesh defined by the Japanese government (e.g., Osawa et al., 2011a, 2013). Akasaka et al. (2014) indicated that any land use map for Japan should integrate the standard Japanese mesh units for ecological use. In fact, Ogawa et al. (2013) have already released a vegetation map with the data transformed to standard mesh units with an integrated classification for ecological use.
In this data paper we converted the CAFF dataset into one of the standard Japanese map units, the standard Japanese Second-order Mesh (approximately 10 km square). This mesh unit is often used for analyzing biodiversity data for all of Japan (e.g., Osawa et al. 2013; Yoshioka et al. 2014). We also constructed a 5-km mesh unit, in which each unit is one quarter the area of the Second-order Mesh units. This unit is also a standard Japanese map unit and is often used for ecological research on a broad scale, such as for prefecture scale, as is the 10-km unit (e.g., Osawa et al. 2011a). Kohyama et al. (2003) previously converted the CAFF dataset into the standard Japanese Third-order Mesh units (approximately 1 km2) and released it through the “gamsDB” website (Osawa et al. 2012). However, this dataset used the old Tokyo Data, and it only includes data from 1970–1995 because of problems with data masking (described below). We compiled the total area of farmland and classified it into the areas of paddy fields, dry farmland, and orchards for the period 1970–2005. We also incorporated abandoned agricultural areas in 2005 because the 2005 CAFF data clearly recorded this. Problems with the source dataset prevented the incorporation of the 2010 data. Many of the data are masked to protect the personal information of farmers, in keeping with recent government policy designed to protect personal information (Ministry of Agriculture, Forestry and Fisheries). All mesh data were re-projected on the World Geodetic System (WGS) Japanese Geodetic Datum 2000 (JGD2000) because map data from before 2002 used the Tokyo Datum (Matsumura et al. 2004). Also, we attached latitude and longitude data for the center of meshes for raster data. The data are referred to as the “Agricultural mesh dataset in Japan” datasets and are available for download from http://agrimeshopen.web.fc2.com/. Users can download the datasets via the internet under a Creative Commons attribution license CC-BY 4.0 International (https://creativecommons.org/licenses/by/4.0/legalcode).
Geographic coverage
All of Japan, excluding small islands.
Spatial resolution
1) Standard Japanese Second-order Mesh
This is a 0° 5′ 0″ × 0° 7′ 30″ grid (i.e., ~10 km × ~10 km), corresponding to a 1:25,000-scale topographic map (Akasaka et al. 2014) and including 4,622 mesh grids in total.
2) Standard Japanese 5-km mesh
Each 5-km mesh grid is one fourth the size of a Second-order Mesh grid, including 17,393 5-km mesh girds in total.
Datum
Japanese Geodetic Datum 2000 (JGD2000)
Temporal coverage
A. Begin: 1970
B. End: 2005
Methods
This study employed agricultural statistical data from the CAFF dataset, which the Ministry of Agriculture, Forestry and Fisheries of Japan compiles every 5 years. We used the eight datasets obtained from 1970 to 2005. The CAFF data were derived from “e-Stat,” which is the website portal used for Japanese government statistical information (Ministry of Internal Affairs and Communications). We obtained the CAFF datasets from the Ministry of Agriculture, Forestry and Fisheries website because this website integrated several raw datasets into prefectural units (CAFF 2005).
The CAFF dataset includes statistical data related to agricultural land area, e.g., total farmland and a breakdown of farmland into categories such as paddy fields and dry farmland, as well as some more detailed categories such as bean and wheat fields (Ministry of Agriculture, Forestry and Fisheries). These records were summarized using hamlet units, which included old municipality units, i.e., one old municipality unit consists of several hamlet units. We aggregated the hamlet units into municipality units using the hamlet records for 2000. The number of hamlet units has gradually decreased as farmers retire, with the greatest number of hamlets existing in 1970 when the period from 1970 to 2005 is considered. The hamlets that have vanished could not be attached to municipalities because the records for old hamlet units were never digitized. Consequently, the area of farmland from the records for 1970 to 1995 was underestimated because we used the hamlet units existing in 2000. In this data paper, we could not use the more detailed crop categories such as beans and wheat, as in Kohyama et al. (2003), because of the masking of locations. If a hamlet had fewer than four farmers, the records were masked to protect the farmers’ personal information (Ministry of Agriculture, Forestry and Fisheries); thus, several values were underestimated. Kohyama et al. (2003) could only use data for 1970–1995 and could not include data from 2000 for the same reason. Use of the larger categories, such as dry farmland, which pools the more detailed categories, allowed us to alleviate much of the underestimation.
To convert the municipality units into Second-order and 5-km mesh units, we divided the municipality units into 100-m (i.e., 1 ha) mesh units, and reconstructed the Second-order and 5-km meshes, which contained 10,000 and 2,500 100-m meshes, respectively. When we divided the municipality units into 100-m mesh units, we partitioned both the total farmland and abandoned agricultural areas equally. If one mesh unit included two or more municipality units, we assigned the mesh unit to the dominant municipality, i.e., the municipality that represented the largest portion of the mesh area. We assumed that the proportions of total farmland and abandoned areas were distributed equally in the 100-m mesh grid within the same municipality. This is the concise conversion technique used by Kohyama et al. (2003). Subsequently, we reconstructed Second-order and 5-km mesh units using 100 × 100-m meshes and summed the areas for all agricultural land use areas. We ignored the numerical error that might occur by dividing the municipality units into the 100-m mesh units because the Second-order and 5-km mesh sizes were sufficiently larger than the 100-m mesh units. We used small 100-m mesh units rather than 1-km grids as the minimum area for reconstructing the Second-order Mesh units because the smallest municipality unit was 1.27 km2 (Ministry of Agriculture, Forestry and Fisheries), and the 1-km mesh did not meet our accuracy requirement. We did not create 1-km mesh data for the same reason. Creating 1-km mesh data using the same methods as the Second-order and 5-km meshes, would have resulted in many neighboring meshes having identical values without a more detailed source dataset, which is only available for purchase from the Association of Agriculture and Forestry Statistics (http://www.aafs.or.jp) (Kohyama et al. 2003). We reconstructed the Second-order and 5-km meshes and calculated the areas of total farmland, paddy fields, other farmland, and orchards in each Second-order Mesh unit. For 2005, we also calculated the abandoned agricultural area because these areas were clearly reported in 2005 (Ministry of Agriculture, Forestry and Fisheries).
The records for 1970 to 2000 were based on the Tokyo Datum. A difference of about 400 m exists between the Tokyo Datum and the Japanese Geodetic Datum 2000 (JGD2000), which is the current standard datum in Japan (Matsumura et al. 2004; Geospatial Information Authority). To make the conversion, we divided the Tokyo Datum mesh according to JGD2000 mesh using the “Intersect” function in a geographic information system (GIS ; ArcGIS, ESRI, California, USA), and then dissolved the resulting mesh into the JGD2000 mesh using the “Dissolve” function in a GIS. Although several methods were available for converting the Datum, we used this method because of its simplicity. Additionally, we believe that any errors in the Second-order and 5-km meshes caused by this conversion were quite small.
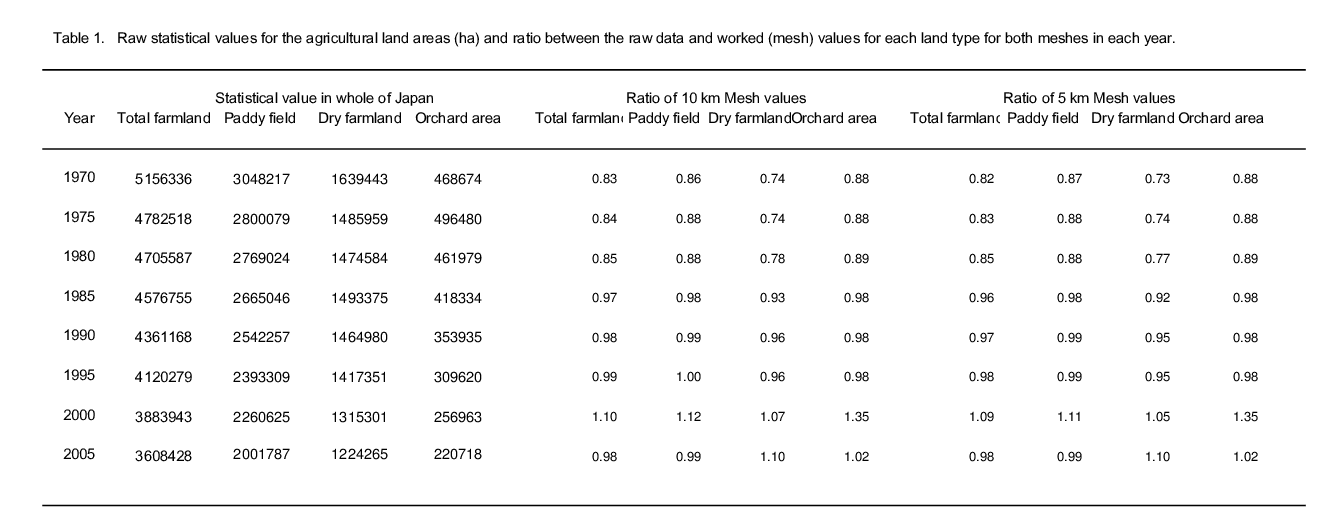
Data Error
From 1970 to 1980, there was an approximately 20% difference between the raw statistical values and the calculated mesh values, with the latter being underestimated (Table 1). After 1985, these errors became quite small. These errors were caused by the hamlet units that vanished, as described above.
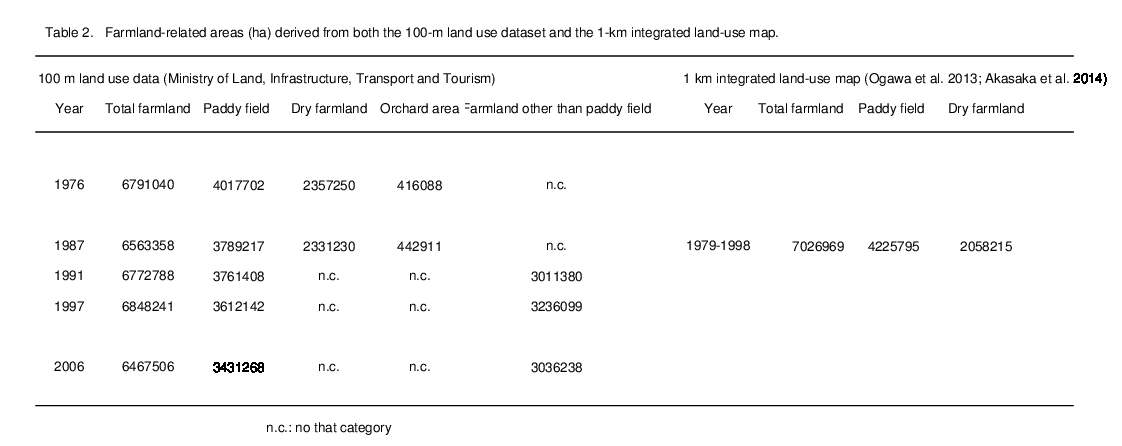
Comparison with other map datasets
We calculated the farmland areas for two existing map datasets. The first was the 100-m land use dataset from the National Land Numerical Information Download Service, Japan, which includes time series for 1976, 1987, 1991, 1997, and 2006 (Matsuda 1980; Yaguchi 1990; Ministry of Land, Infrastructure, Transport and Tourism, Japan). We calculated the sum of areas for five categories related to farmland: total farmland, paddy field, dry farmland, orchard areas, and farmland other than paddy field. Some years lacked one or two categories because the categories were not consistent every year (Ministry of Land, Infrastructure, Transport and Tourism, Japan). The second dataset was the 1-km integrated land use map (Ogawa et al. 2013; Akasaka et al. 2014) derived from National Institute for Environmental Studies (Center for Environmental Biology and Ecosystem Studies, National Institute for Environmental Studies). This dataset was based on the second to fifth natural environmental research surveys conducted by the Japanese Ministry of Environment from 1979 to 1998. We calculated the sum of areas for total farmland, paddy field, dry farmland, and orchards. The sum of all categories, excluding orchards, was greater for both datasets than for our statistical baseline data regardless of year (Table 2). These differences were assumed to exist because of a difference among in data resources, specifically the aerial photo database (100-m land use dataset), field survey database (1-km integrated land use map) and statistical database (our dataset).
Data file information
Object name: Agricultural mesh dataset in Japan
Character encoding: UTF-8
Format name: Normal text with comma separated variables
Language: English
Acknowledgements
We would like to thank the staff of the Natural Resources Inventory Center in the National Institute for Agro-Environmental Sciences for their valuable support. A Grant-in-aid for Young Scientists (No. 24710038) from the Japan Society for the Promotion of Science and the Environment Research partially supported this work.
References
Akasaka M, Takenaka A, Ishihama F, Kadoya T, Ogawa M, Osawa T, Yamakita T, Tagane S, Ishii R, Nagai S (2014) Development of a National Land-Use/Cover Dataset to Estimate Biodiversity and Ecosystem Services Integrative Observations and Assessments. Springer, pp. 209-229
De Groot RS, Wilson MA, Boumans RM (2002) A typology for the classification, description and valuation of ecosystem functions, goods and services. Ecological economics 41: 393-408.
Foley JA, Ramankutty N, Brauman KA, Cassidy ES, Gerber JS, Johnston M, Mueller ND, O’Connell C, Ray DK, West PC (2011) Solutions for a cultivated planet. Nature 478: 337-342.
Kamusoko C, Aniya M (2007) Land use/cover change and landscape fragmentation analysis in the Bindura District, Zimbabwe. Land Degradation & Development 18: 221-233.
Katayama N, Amano T, Naoe S, Yamakita T, Komatsu I, Takagawa S-i, Sato N, Ueta M, Miyashita T (2014) Landscape Heterogeneity—Biodiversity Relationship: Effect of Range Size. PloS one 9: e93359.
Kohyama K, Hojiti M, Sasaki H, Miyaji H (2003) Generation of agricultural statistics mesh data using digital national land information. Japanese Journal of Soil Science and Plant Nutrition 74: 415-424 (in Japanese).
Matsuda H (1980) Digital National Land Information. GeoJournal 4: 313-318.
Matsumura S, Murakami M, Imakiire T (2004) Concept of the new Japanese geodetic system. Bulletin of the Geospatial Information Authority of Japan 51:1-9.
Ogawa M, Takenaka A, Kadoya T, Ishihama F, Yamano H, Akasaka M (2013) Land-use classification and mapping at a whole scale of Japan based on a national vegetation map. Jpn J Conserv Ecol 18: 69-76 (in Japanese).
Osawa T, Kohyama K, Mitsuhashi H (2013) Areas of Increasing Agricultural Abandonment Overlap the Distribution of Previously Common, Currently Threatened Plant Species. PloS one 8: e79978.
Osawa T, Kohyama K, Kuwagata T, Sudo S (2012) Web interface for integration of diverse agro-environmental databases. Agricultural Information Research 21: 1-10 (in Japanese).
Osawa T, Mitsuhashi H, Niwa H, Ushimaru A (2011a) The role of river confluences and meanderings in preserving local hot spots for threatened plant species in riparian ecosystems. Aquatic Conservation: Marine and Freshwater Ecosystems 21: 358-363.
Osawa T, Mitsuhashi H, Uematsu Y, Ushimaru A (2011b) Bagging GLM: improved generalized linear model for the analysis of zero-inflated data. Ecological Informatics 6: 270-275.
Ries J (2010) Methodologies for soil erosion and land degradation assessment in mediterranean type ecosystems. Land Degradation & Development 21: 171-187.
Tsuji M, Ushimaru A, Osawa T, Mitsuhashi H (2011) Paddy-associated frog declines via urbanization: A test of the dispersal-dependent-decline hypothesis. Landscape and Urban Planning 103: 318-325.
Yaguchi A (1990) Digital National Land Information. J Geogr 99:541-549.
Yoshioka A, Akasaka M, Kadoya T (2014) Spatial Prioritization for Biodiversity Restoration: A Simple Framework Referencing Past Species Distributions. Restoration Ecology 22: 185-195.
Zimmermann NE, Edwards TC, Graham CH, Pearman PB, Svenning JC (2010) New trends in species distribution modelling. Ecography 33: 985-989.
Web references
Census for Agriculture, Forestry and Fisheries, 2005 (CAFF 2005) http://www.maff.go.jp/j/tokei/census/afc/2010/05kekka.html [Accessed at 9, Mar, 2015]
Ministry of Agriculture, Forestry and Fisheries; Census for Agriculture, Forestry and Fisheries http://www.maff.go.jp/j/tokei/census/afc/ [Accessed at 9, Mar, 2015]
Ministry of the Environment, Biodiversity Center http://www.biodic.go.jp/ [Accessed at 9, Mar, 2015]
Geospatial Information Authority http://www.gsi.go.jp/ [Accessed at 9, Mar, 2015]
Ministry of Land, Infrastructure, Transport and Tourism; The National Land Numerical Information represents numerical data http://nlftp.mlit.go.jp/ksj-e/index.html [Accessed at 9, Mar, 2015]
Ministry of Internal Affairs and Communications; Statistics Bureau http://www.e-stat.go.jp/SG1/estat/eStatTopPortalE.do [Accessed at 9, Mar, 2015]
Center for Environmental Biology and Ecosystem Studies, National Institute for Environmental Studies. http://www.nies.go.jp/biology/kiban/lu/index.html [Accessed at 9, Mar, 2015]
