metadata
Title
Reflectance and transmittance spectra of leaves and shoots of 22 vascular plant species and reflectance spectra of trunks and branches of 12 tree species in Japan
Authors
Hibiki M. Noda1*, Takeshi Motohka2, Kazutaka Murakami3, Hiroyuki Muraoka4, Kenlo Nishida Nasahara5
- 1. Center for Global Environmental Research, National Institute for Environmental Studies, 16-2 Onogawa, Tsukuba, Ibaraki 305-8506, Japan
- 2. Earth Observation Research Center, Japan Aerospace Exploration Agency, 2-1-1 Sengen, Tsukuba, Ibaraki 305-8505, Japan
- 3. Center for Environmental Measurement and Analysis, National Institute for Environmental Studies, 16-2 Onogawa, Tsukuba, Ibaraki 305-8506, Japan
- 4. Institute for Basin Ecosystem Studies, Gifu University, 1-1 Yanagido, Gifu 501-1193, Japan
- 5. Faculty of Life and Environment Sciences, University of Tsukuba, 1-1-1 Tennodai, Tsukuba, Ibaraki 305-8572, Japan
*Corresponding author:
Dr Hibiki M. NODA
Address: 16-2 Onogawa, Tsukuba, Ibaraki 305-8506, Japan.
Tel: +81(29)850-2981
Fax: +81(29)850-2219
E-mail: noda.hibiki@nies.go.jp
Abstract
This data paper reports spectral reflectance and transmittance data of leaves from 21 terrestrial vascular plant species (7 herbaceous, and 14 broadleaf and long-needle coniferous tree species) and of shoots from one short-needle coniferous tree species. The reflectance spectra of branches of one tree species and of the trunks of 12 tree species are also reported. Optical measurements and leaf samplings were made at five sites on Honshu Island, Japan, which are typical vegetation types in East Asia, i.e., grassland, paddy field and deciduous broad-leaf or coniferous forests. The collection and measurements were conducted for main species in each site. To include other common vegetation types in East Asia, such as evergreen broad-leaf or coniferous forests, the sample collection and the measurements were conducted at gardens and an experimental forest. Leaves of 10 deciduous species were measured at different phenological stages from leaf expansion to senescence since those species shows significant seasonal changes in spectral reflectance and transmittance of leaves. Leaves at different position in a canopy (e.g., sunlit versus shaded leaves) were also measured for 8 of 21 species. The spectral reflectance and transmittance from both adaxial and abaxial sides of the all leaves or needles, expect Picea abies needles. The measurements of the leaves were conducted with a spectroradiometer attached via an optical fibre to an integrating sphere. Two types of integrating spheres were used: a model LI-1800-12 (Li-Cor) and an RTS-3ZC integrating sphere ( Analytical Spectral Devices). A leaf clip accessory was also used instead of an integrating sphere for measuring the leaves of two species. All data were measured within the 350–2500 nm spectral range with 1-nm steps between measurements but the data obtained by LI-1800 is unavailable in 1650-1740, 1890-1950 and 2050-2500 nm because of big noise. These data is used as input parameters in a radiative transfer model designed to estimate the leaf area index from radiation reflected from a canopy surface.
Keywords
Broad leaves, coniferous needles, integrating sphere, leaf clip, phenological change, spectroradiometer
Introduction
The reflectance and transmittance of radiation by leaves and reflectance from branches and trunks of a canopy affect the diffuse light environment which can be expressed by radiative transfer models (Verhoef 1984), and the reflected radiation from the canopy surface is utilized for optical remote sensing of vegetation structure (Field 1995; Ustin et al. 2004). Thus, the optical properties of leaves, branches, and trunks are key to interpreting measurements made by spectroradiometers mounted on towers, aircraft, or Earth-observation satellites (e.g., Running et al. 2004; Muraoka and Koizumi 2009).
The leaf optical properties vary among species (Fig. 1). Several databases of leaf optical properties have been already published: LOPEX93 (Leaf Optical Properties Experiment 93; http://ies.jrc.ec.europa.eu/index.php?page=data-portals) contains leaf optical properties of common species in Europe including crops and Carnegie Spectranomics project (http://spectranomics.stanford.edu/) is also preparing to publish data of broad-leaf species inhabiting tropical regions. However the information reported by those databases is not enough for accurate estimation of canopy structure or radiation profile within the canopy by remote-sensing and/or radiative transfer models, especially in East Asia. For example, rice (Oryza sativa L.) is one of the most important crops in East Asia while no database has reported its optical properties. Coniferous forests are also very common in East Asia. LOPEX93 reports reflectance spectra of needles for four evergreen coniferous species. However no database includes the transmittance spectra of coniferous needles. In addition, it is necessary to consider the variations in leaf optical properties within a species: The adaxial side of a leaf has different optical properties from the abaxial side in many plant species (Noda et al. 2013; Fig. 1a; Fig. 2), and the differences between the two are important for canopy modelling and observation (Stuckens et al. 2009a, b). The optical properties can vary with the light environment of the leaf (Fig. 2) and show notable seasonal changes (Noda et al. 2013; Fig. 3). However those variations within a species are not reported in above-mentioned databases. To simulate radiative transfer within a canopy, reflectance spectrum of tree trunks, branches and ground surface is also necessary and trunk reflectance varies among species (Fig. 4). Thus the optical properties of leaves, branches, and trunks of multiple species and of leaves of different types and at different seasons must be useful.
Optical properties are typically measured by a spectroradiometer attached via an optical fibre to an integrating sphere. The inside of the sphere is covered with a highly reflective and diffusive material, such as BaSO4 and PTFE, that scatters the incoming radiation, which is then detected by the spectroradiometer. Thereby the influence of the specular reflection and/or the roughness of the leaf surface are removed from the measured value. One of the most well-regarded integrating spheres is LI-1800-12 model (Li-Cor, Lincoln, NE, USA; Daughtry et al. 1989; Knapp and Carter 1998; Carter and Knapp 2001; Asner et al. 2009). Although the LI-1800 integrating sphere adequately measures radiation with visible and near-infrared wavelengths, it performs poorly in measuring radiation wavelengths longer than 1650 nm (Fig. 5a, c). Especially the data is not available in the ranges of 1650-1740 nm, 1890-1950 nm and above 2050 nm because of huge noise. The leaf optical data in the short-wavelength infrared region includes information related to water content and leaf chemical traits such as lignin, cellulose and sugar (Jones and Vaughan 2010). To obtain the data in the region, the RTS-3ZC Integrating Sphere (Analytical Spectral Devices, Boulder, CO, USA), which provides clear data under 1800 nm (Fig. 5b) can be used. However the data obtained by RTS-3Z is slightly inaccurate: In near infrared region, where both reflectance and transmittance of a leaf are high, the sum of reflectance and transmittance sometimes exceeds 1.0 (e.g., the reflectance and the transmittance spectra from abaxial side in Fig.5b) and it means that the reflectance and/or the transmittance are overestimated. The Leaf Clip accessory (Analytical Spectral Devices), which can be also used instead of an integrating sphere, provides clear reflectance data in the 350–2500 nm range (Fig. 5d). However the data measured by the leaf clip can be influenced by the specular reflection and the roughness of the leaf surface. In addition it is difficult to measure transmittance with the leaf clip. Thus if there are available datasets obtained by several instruments, data-users must select the preferable one depends on the wavelength and/or accuracy required for the analysis.
The reported data comprise spectral reflectance and transmittance data of the leaves of 21 vascular plant species (7 herbaceous species and 14 broadleaf and long-needle coniferous tree species) and of the shoots of Cryptomeria japonica, and reflectance spectra of the trunks of 12 tree species and of the branches of Larix kaempferi. We selected dominated species of typical vegetation types and common species in East Asia. The reflectance from ground surface in a deciduous broad-leaf forest is also reported. The leaves of 10 species were measured in different seasons, and multiple leaf types, such as sunlit and shaded leaves, of eight species were measured. Leaves and shoots were measured with a FieldSpec FR or a FieldSpec 3 spectroradiometer (Analytical Spectral Devices) and with an LI-1800 and/or RTS-3ZC integrating sphere, except that leaves of Eurya japonica and Machilus thunbergii were measured with both the LI-1800 and the Leaf Clip accessory. The measurement range of both the FieldSpec FR and the FieldSpec 3 are 350–2500 nm with 1 nm step and they are calibrated once a year. The reflectance of trunks, branches and ground was measured with the spectroradiometers and the LI-1800 integrating sphere.
A part of these data will be used as input parameters for a radiative transfer model to estimate leaf area index as a product of GCOM-C1, which is a new satellite planned to launch by JAXA.
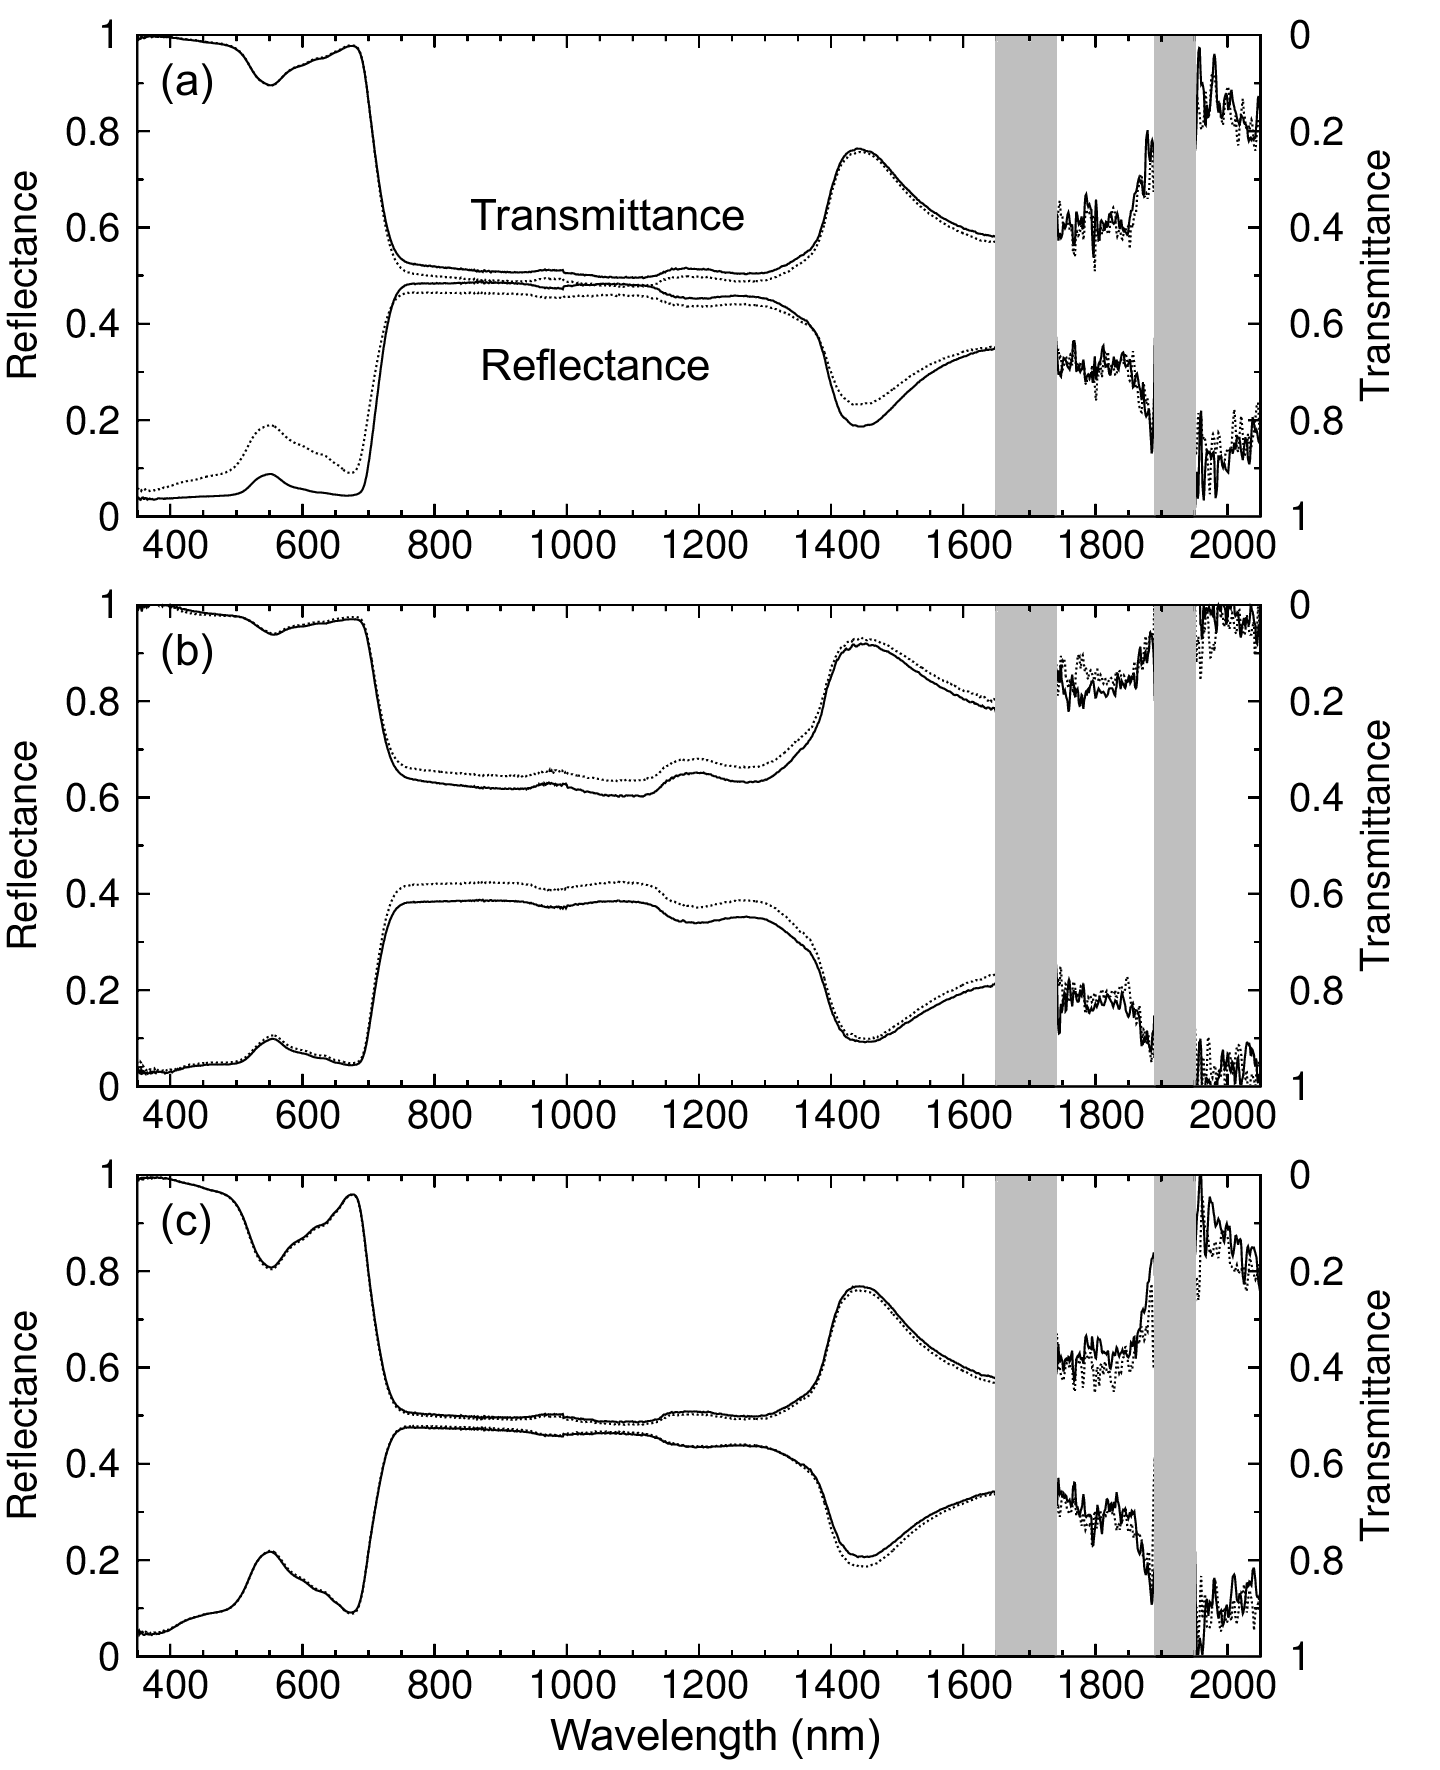
Fig. 1 Reflectance and transmittance spectra of leaves of (a) Betula ermanii (data record is “Betula_leaf_first_2010_0802_1_LICOR.csv”), (b) Pinus densiflora (“Pinus_leaf__2012_0222_1_LICOR.csv”), and (c) Imperata cylindrica (“Imperata_leaf__2010_0914_1_LICOR.csv”). Solid and dashed lines show values from the adaxial and abaxial sides, respectively. The width of the gap between the two curves in each graph shows the absorbance spectrum. Ranges of 1650-1740 and 1890-1950 nm are shaded because the data measured by LI-1800 integrating sphere were not available.
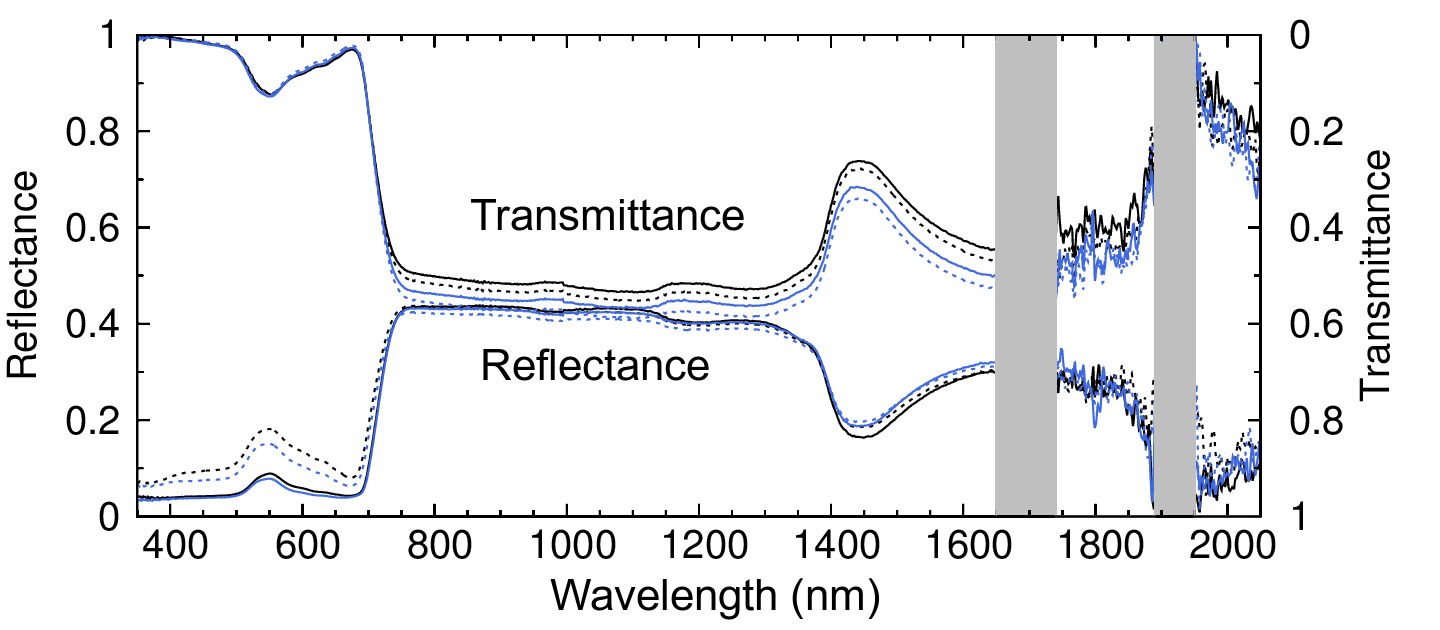
Fig. 2 Reflectance and transmittance spectra of sunlit (black lines) and shade (blue lines) leaves of Quercus crispula in August. Solid and dashed lines show values from the adaxial and abaxial sides, respectively. Ranges of 1650-1740 and 1890-1950 nm are shaded because the data measured by LI-1800 integrating sphere were not available

Fig. 3 Reflectance and transmittance spectra of a Larix kaempferi leaf in (a) summer (data record is “Larix_leaf_long_2011_0802_1_LICOR.csv”) and (b) autumn (“Larix_leaf_yellow_2011_1030_1_LICOR.csv”). Ranges of 1650-1740 and 1890-1950 nm are shaded because the data measured by LI-1800 integrating sphere were not available
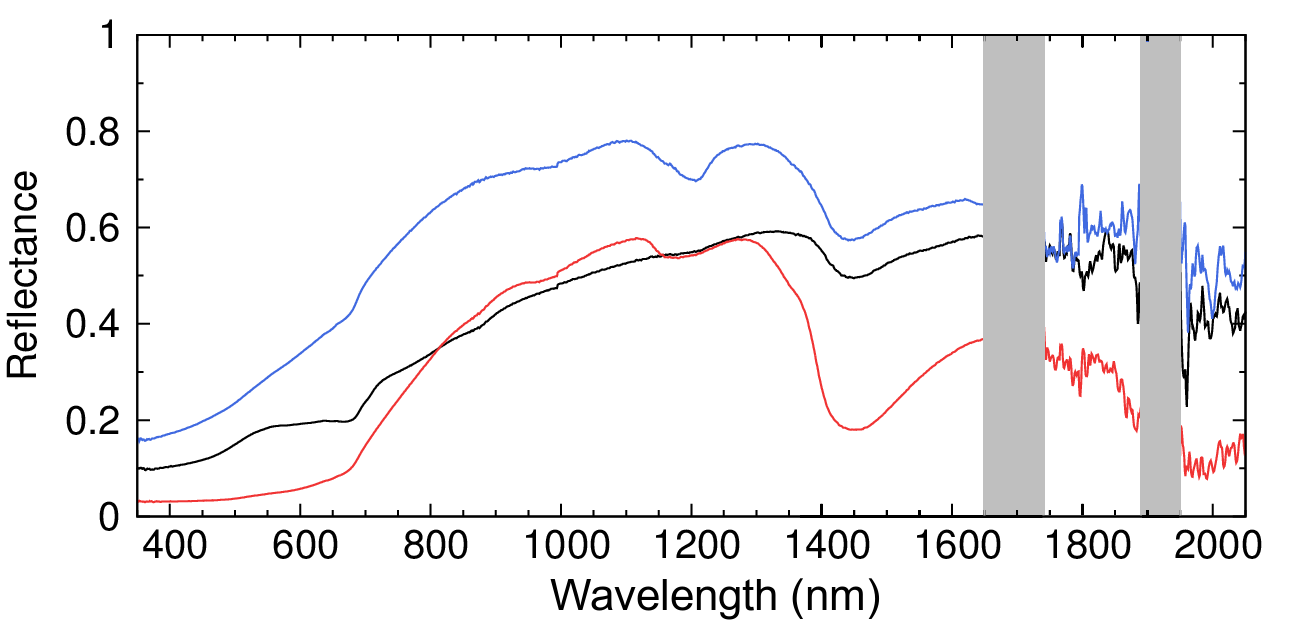
Fig. 4 Reflectance spectra of trunks of Quercus myrsinifolia (blue line), Q. crispula (black line), and Cryptomeria japonica (red line). Ranges of 1650-1740 and 1890-1950 nm are shaded because the data measured by LI-1800 integrating sphere were not available
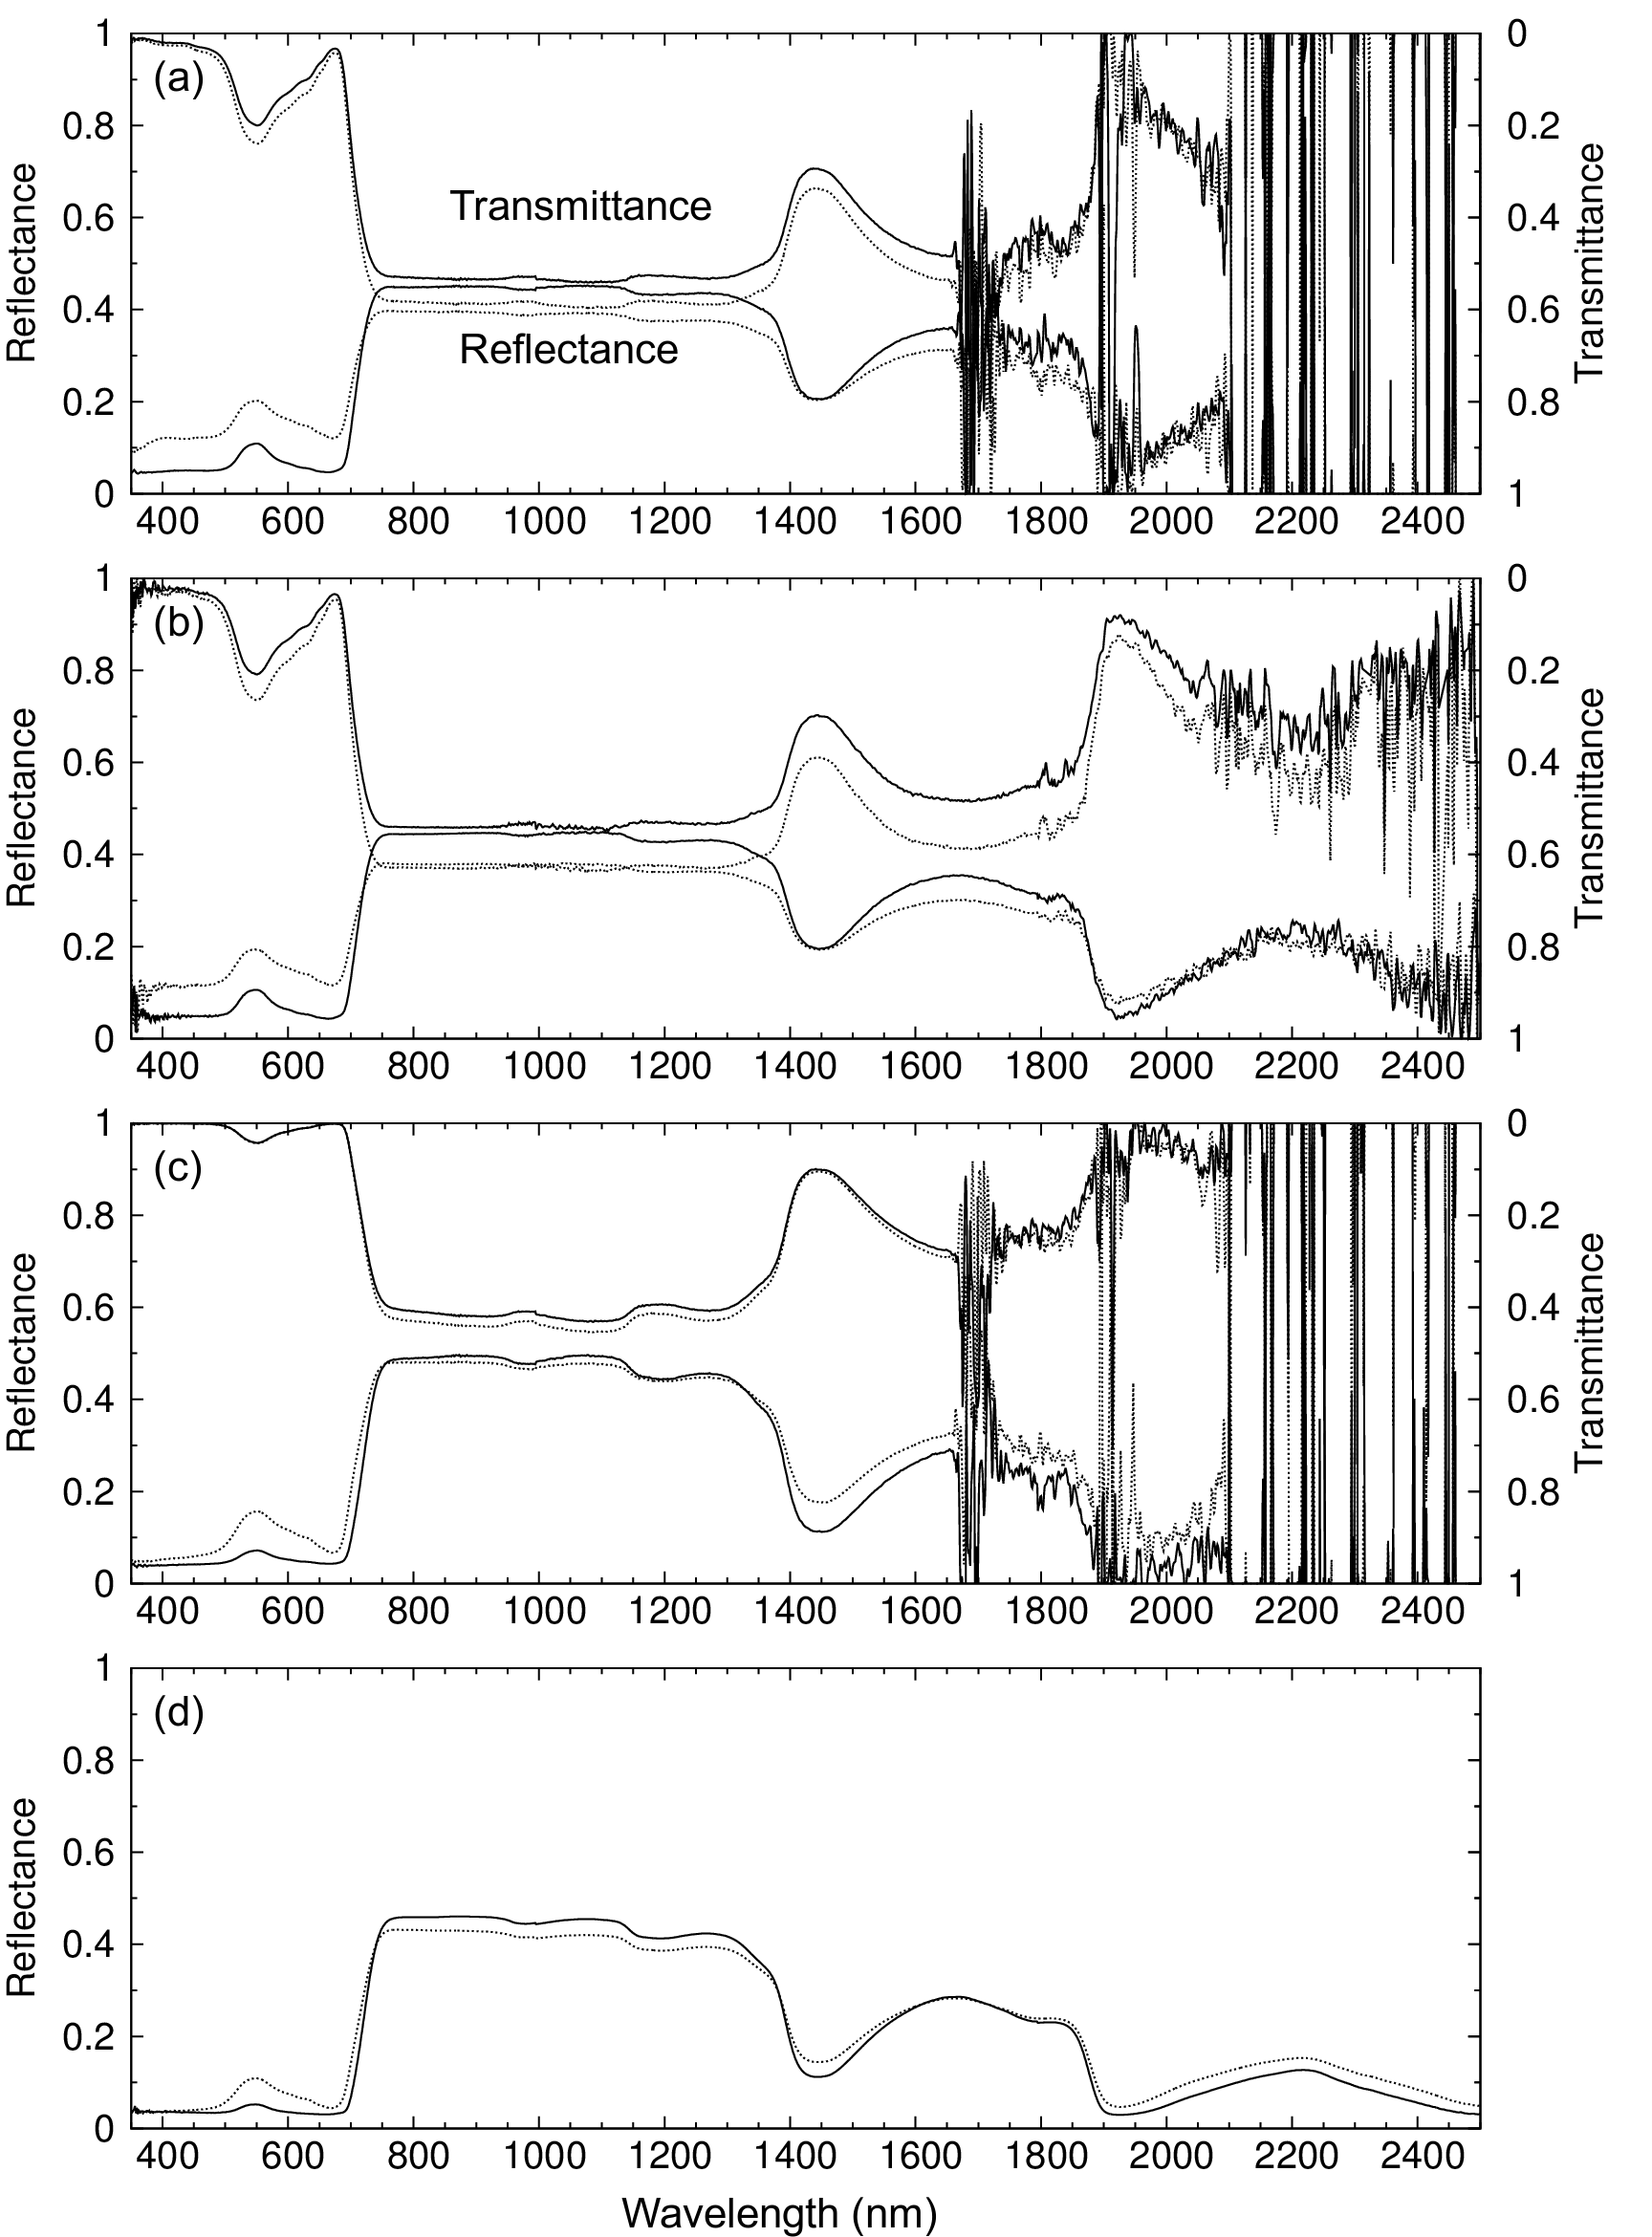
Fig. 5 Examples of reflectance and transmittance spectra measured with (a) the LI-1800 or (b) RTS-3ZC integrating sphere ( Hydrangea paniculata leaf) and (c) the LI-1800 or (d) reflectance spectrum with Leaf Clip ( Eurya japonica leaf). Solid and dashed lines show values from the adaxial and abaxial sides, respectively.
Metadata
1. Title
The reflectance and transmittance spectra of leaves for 22 species and the reflectance of trunks for 12 species in Japan
2. Identifier
ERDP-2013-02
3. Contributor
A. Data Set Owner
Hibiki M. NODA
Address: 16-2 Onogawa, Tsukuba, Ibaraki 305-8506, Japan
Tel: +81(29)850-2981
Fax: +81(29)850-2219
E-mail: noda.hibiki@nies.go.jp
B. Contact Person
Hibiki M. NODA
Address: 16-2 Onogawa, Tsukuba, Ibaraki 305-8506, Japan
Tel: +81(29)850-2981
Fax: +81(29)850-2219
E-mail: noda.hibiki@nies.go.jp
4. Projects
A. Titles
1. Development of integrative information of the terrestrial ecosystem
2. Funding Program for Next Generation World-Leading Researchers (NEXT Program)
3. JSPS-NRF-NSFC A3 Foresight Program
B. Personal
1. Kenlo Nishida Nasahara
Address: 1-1-1 Tennohdai, Tsukuba, Ibaraki 305-8572, Japan
Tel./Fax: +81(29)853-4897
E-mail: 24dakenlo@gmail.com
2 and 3. Hiroyuki Muraoka
Address: 1-1 Yanagido, Gifu 501-1193, Japan
Tel./Fax: +81-58-293-2064
E-mail: muraoka@green.gifu-u.ac.jp
C. Funding:
1. Global Change Observation Mission (GCOM) of the Japan Aerospace Exploration Agency (JAXA)
2. Japan Society for the Promotion of Science (JSPS)
3. JSPS
5. Geographic coverage
A. Geographic Description:
Kanto and Chubu regions in Japan
B. Bounding Coordinates:
West: 137.37° E
East: 140.13° E
North: 36.15° N
South: 35.44° N
6. Temporal coverage
A. Begin:
2010
B. End:
2013
7. Taxonomic coverage
Data were obtained from 28 genera and 30 species.
8. Methods
A. Study sites
Sample collection and trunk measurements were conducted at the following eight sites:
- 1) University of Tsukuba (36° 07′ N, 140° 08′ E), Tsukuba City, Ibaraki, Japan
- 2) Tsukuba Experimental Forest of the University of Tsukuba (36° 07′ N, 140° 08′ E; a forest plantation), Tsukuba City, Ibaraki, Japan
- 3) The experimental grassland at the Terrestrial Environmental Research Center of the University of the Tsukuba (36° 07′ N, 140° 08′ E; dominated by Miscanthus sinensis and Miscanthus sinensis; see Saigusa et al. 1998 for a more detailed description), Tsukuba, Ibaraki, Japan
- 4) Mase paddy flux site (36° 03′ N, 140° 01′ E; dominated by Oryza sativa; see Saito et al. 2005), Tsukuba, Ibaraki, Japan
- 5) Chiba University (35° 37′ N, 140° 07′ E), Chiba City, Chiba, Japan
- 6) Fuji-hokuroku Flux Research Site (35° 26′ N, 138° 45′ E; dominated by Larix Kaempferi; see Ueyama et al. 2012), Fujiyoshida City, Yamanashi, Japan
- 7) Takayama deciduous broadleaf forest site (36° 08′ N, 137° 25′ E; dominated by Quercus crispula and Betula ermanii; see Ohtsuka et al. 2009), Takayama City, Gifu, Japan
- 8) Takayama evergreen coniferous forest site (36° 08′ N, 137° 22′ E; dominated by Cryptomeria japonica; see Saitoh et al. 2010), Takayama City, Gifu, Japan
B. Measurement methods
Measurements were made with a FieldSpec FR or a FieldSpec 3 spectroradiometer attached via optical fibre to an integrating sphere (LI-1800 or RTS-3ZC) or a Leaf Clip. Representative leaves, shoots, and branches in the canopy were harvested and measured in the laboratory within a few hours of collection. Representative points of tree trunks in the site were selected and measured on-site.
B-1. Measurement of broad leaves with an integrating sphere
Leaves were measured following the standard protocol described by Noda et al. (2013) with the LI-1800 and/or RTS-3ZC.
B-2. Measurement of narrow leaves or coniferous needles with an integrating sphere
Some leaf blades and coniferous needles are narrower than the diameter of the sample port of the integrating sphere. We used the protocol for narrow leaves and needle leaves described by Noda et al. (2013) to measure such leaves with the LI-1800, the RTS-3ZC, or both.
B-3. Measurement of leaves with the leaf clip
Leaf reflectance (ρl) was measured by using the following protocol:
1. The flux (Fw) of the inward-facing white background standard without any leaf was first measured.
2. Then, a leaf was then inserted into the leaf clip with an inward-facing black background standard and the flux (Flr) was measured.
3. ρl was derived as follows:
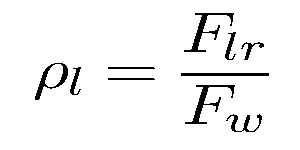
It was assumed that the reflectance of the black background is zero and white background standard is 1.0.
B-4. Measurement of the optical properties of tree trunks
The reflectance spectrum of tree trunks ( ρt ) was measured with an LI-1800 integrating sphere. The sample holder on the exterior of the sphere was removed and then the sample port was fixed to the tree trunk (see Fig. 6). The trunk was then measured in white reference (Ftw ) and reflectance (Ftr) modes (Fig. 6a, b). ρt was derived as follows:
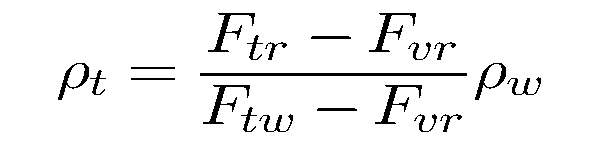
where
ρw = reflectance of the BaSO4 reference surface, a known value (0.95–0.99, depending on wavelength)
Fvr = flux of stray light (see Noda et al. 2013).
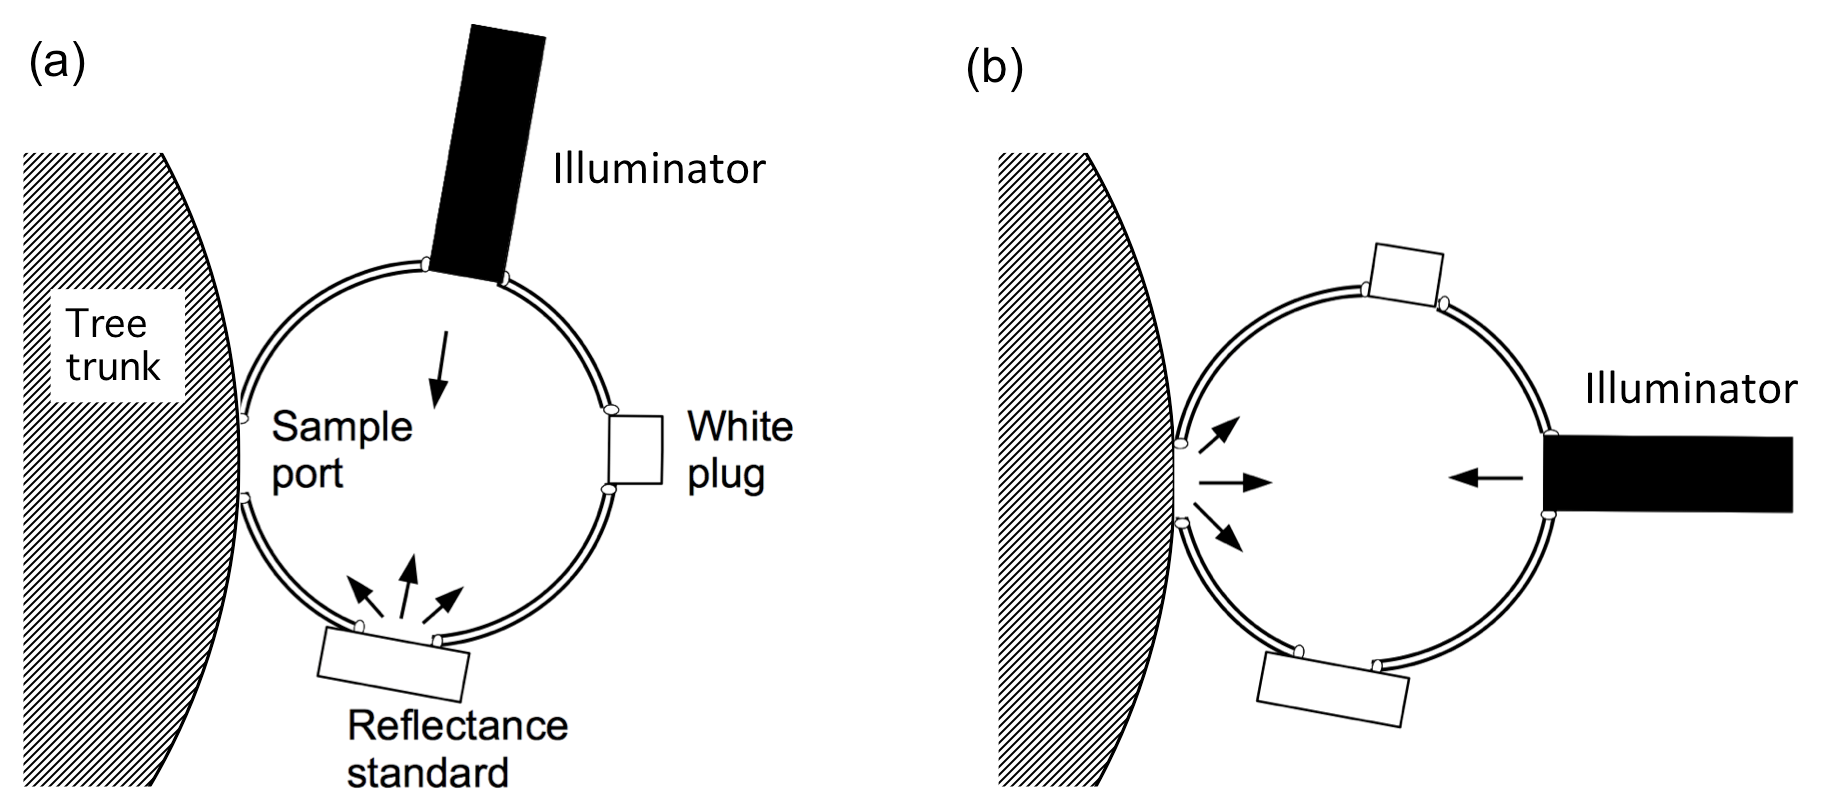
Fig. 6 The LI-1800 integrating sphere configured in (a) reference mode and (b) reflectance mode for measuring the reflectance from a tree trunk.
B-5. Measurement of branches with the integrating sphere
The measurement protocol for narrow leaves and needle leaves described by Noda et al. (2013) is valid for various types of leaves, including senesced leaves. Therefore, the reflectance of the branches was measured with an LI-1800 integrating sphere by using this protocol.
B-6. Measurement of the optical properties of ground surface
The reflectance spectrum of ground surface was measured with an LI-1800 integrating sphere by using the protocol for tree trunks (B-4).
9. DATA STRUCTURE
Each file includes the data obtained by one measurement.
A. Format type
The data files are in Comma-Separated Values (csv).
B. Naming rules of the data files
The data files are named
{a}_{b}_{c}_{d}_{e}_{f}_{g}.csv
where each letter stands for the following information:
| a | Genus for leaf, shoot, branch and trunk data (species names are described in Appendix) or vegetation type for ground surface data, where DBF means deciduous broad-leaf forest. |
|---|---|
| b | Plant part (“leaf”, “shoot”, “trunk”, or “branch”) or “ground”. |
| c | Leaf type, e.g., “sun” means sunlit leaf (see Appendix). |
| d | Year the original data were obtained. |
| e | Date that the original data were measured, shown as “MMDD”. |
| f | ID number of the sample. |
| g | The equipment used, where “LICOR”, “ASDIS”, and “ASDLC” mean the LI-1800 integrating sphere, the RTS-3ZC, and Leaf Clip, respectively. |
Files with the same information in fields a–f are data files for the same sample: e.g., “Betula_leaf_first_2010_0802_1_LICOR.csv” and “Betula_leaf_first_2010_0802_1_ASDIS.csv”. The information about the spectroradiometer, which used for the measurement was described in Appendix.
C. Header information
The first three rows of each data file contain the following header information:
Row 1: the date the file was made and the name of the file creator
Row 2: information about the data including the species name (data of leaf, shoot, branch and trunk) or site (ground)
Row 3: the data sequence
D. Data sequence
D-1. Leaf and shoot data files obtained with an integrating sphere
The columns contain the following data:
| 1st column | Wavelength (350–2500 nm, 1-nm steps) |
|---|---|
| 2nd column | Reflectance spectrum from adaxial side of the leaf |
| 3rd column | Transmittance spectrum from adaxial side of the leaf |
| 4th column | Reflectance spectrum from abaxial side of the leaf |
| 5th column | Transmittance spectrum from abaxial side of the leaf |
Note 1: the data sequences of the following types of data are different.
| Pinus densiflora needles | The curved and flat surfaces of the needle are called the “adaxial” and “abaxial” sides, respectively. |
|---|---|
| Picea abies needles | Abaxial and adaxial sides are not distinguished. The 4th and 5th columns duplicate the information in the 2nd and 3rd columns. |
| Cryptomeria japonica shoots | The upper and lower sides of the shoot are described as “adaxial” and “abaxial”, respectively |
Note 2: The data obtained by LI-1800 is described as “-9.999” as the dummy data in 1650-1740, 1890-1950 and 2050-2500 nm because the data in those regions is unavailable.
D-2. Leaf files obtained with a leaf clip
| 1st column | Wavelength (350–2500 nm, 1-nm steps) |
|---|---|
| 2nd column | Reflectance spectrum from adaxial side of the leaf |
| 3rd column | Reflectance spectrum from abaxial side of the leaf |
D-3. Data files of trunks and branches
| 1st column | Wavelength (350–2500 nm, 1-nm steps) |
|---|---|
| 2nd column | Reflectance spectrum |
Note: The data is described as “-9.999” as the dummy data in 1650-1740, 1890-1950 and 2050-2500 nm because the data in those regions is unavailable.
D-4. Data files of ground surface
| 1st column | Wavelength (350–2500 nm, 1-nm steps) |
|---|---|
| 2nd column | Reflectance spectrum |
Note: The data obtained by LI-1800 in 1650-1740, 1890-1950 and 2050-2500 nm. data is described as “-9.999” as the dummy data.
10. Acknowledgments
We sincerely thank Professor Y. Honda and Dr K. Kajiwara of Chiba University for making the FieldSpec FR spectroradiometer and the Leaf Clip available for our use. This research was supported by a Global Change Observation Mission (PI#102) of the Japan Aerospace Exploration Agency (JAXA), a JSPS Funding Program for Next Generation World-Leading Researchers (NEXT Program) and a JSPS-NRF-NSFC A3 Foresight Program.
11. Literature Cited
Asner GP, Martin RE, Ford AJ, Metcalfe DJ, Liddell MJ (2009) Leaf chemical and spectral diversity in Australian tropical forests. Ecol Appl 19: 236–253
Carter GA, Knapp AK (2001) Leaf optical properties in higher plants: linking spectral characteristics to stress and chlorophyll concentration. Am J Bot 88: 677–684
Daughtry CST, Biehl L, Ranson K (1989) A new technique to measure the spectral properties of conifer needles. Remote Sensing of Environment 27: 81–91
Davis PA, Caylor S, Whippo CW, Hangarter RP (2011) Changes in leaf optical properties associated with light-dependent chloroplast movements. Plant Cell Environ 34: 2047–2059
Field CB, Randerson JT, Malmström CM (1995) Global net primary production: combining ecology and remote sensing. Remote Sensing of Environment 51: 74–88
Jones HG, Vaughan RA (2010) Remote sensing of vegetation. Oxford University Press, Oxford New York.
Knapp AK, Carter GA (1998) Variability in leaf optical properties among 26 species from a broad range of habitats. Am J Bot 85: 940–948
Muraoka H, Koizumi H (2009) Satellite Ecology (SATECO)—linking ecology, remote sensing and micrometeorology, from plot to regional scale, for the study of ecosystem structure and function. J Plant Res 122: 3–20
Noda HM, Motohka T, Murakami K, Muraoka H, Nasahara KN (2013) Accurate measurement of optical properties of narrow leaves and conifer needles with a typical integrating sphere and spectroradiometer. Plant Cell Environ, 36: 1903-1909
Ohtsuka T, Saigusa N, Koizumi H (2009) On linking multiyear biometric measurements of tree growth with eddy covariance-based net ecosystem production. Glob Change Biol 15: 1015–1024
Running SW, Nemani RR, Heinsch FA, Zhao M, Reeves M, Hashimoto H (2004) A continuous satellite-derived measure of global terrestrial primary production. BioScience, 56: 547-560
Saigusa N, Oikawa T, Liu S (1998) Seasonal variations of the exchange of CO2 and H2O between a grassland and the atmosphere: An experimental study. Agricultural and Forest Meteorology 89: 131–139
Saito M, Miyata A, Nagai H, Yamada T (2005) Seasonal variation of carbon dioxide exchange in rice paddy field in Japan. Agricultural and Forest Meteorology 135: 93–109
Saitoh TM, Tamagawa I, Muraoka H, Lee N-YM, Yashiro Y, Koizumi H (2010) Carbon dioxide exchange in a cool-temperate evergreen coniferous forest over complex topography in Japan during two years with contrasting climates. J Plant Res 123: 473–83
Stuckens J, Verstraeten WW, Delalieux S, Swennen R, Coppin P (2009) A dorsiventral leaf radiative transfer model: Development, validation and improved model inversion techniques. Remote Sensing of Environment 113: 2560–2573
Ueyama M, Hamotani K, Nishimura W, Takahashi Y, Saigusa N, Ide R (2012) Continuous measurement of methane flux over a larch forest using a relaxed eddy accumulation method. Theoretical and Applied Climatology 109: 461–472
Ustin SL, Roberts DARA, Gamon JA, Gregory P, Green RO (2004) Using imaging spectroscopy to study ecosystem processes and properties. BioScience 54: 523–534
Verhoef W (1984) Light scattering by leaf layers with application to canopy reflectance modeling: the SAIL model. Remote Sensing of Environment 16: 125–141
